Reports bringing up the statistical history of the European Army in India and of the Native Army and jail population of Bengal to 1876 : and the cholera history of 1875 and 1876, in continuation of reports embracing the period from 1817 to 1872 / by J.L.Bryden.
- James Bryden
- Date:
- 1878
Licence: Public Domain Mark
Credit: Reports bringing up the statistical history of the European Army in India and of the Native Army and jail population of Bengal to 1876 : and the cholera history of 1875 and 1876, in continuation of reports embracing the period from 1817 to 1872 / by J.L.Bryden. Source: Wellcome Collection.
Provider: This material has been provided by Royal College of Physicians, London. The original may be consulted at Royal College of Physicians, London.
262/358 (page 242)
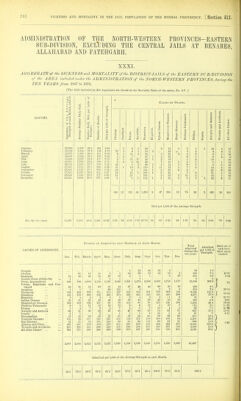
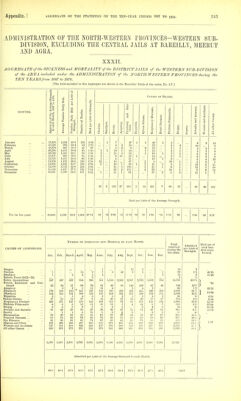
![ADMINISTRATION OF THE NORTH-WESTEM PROVINCES-EASTERN SUB-DIVISION, EXCLlJDING THE CENTRAL JAILS AT BENARES ALLAHABAD AND EATEHGARH. XXXI. AGGBEGATE of the SICKNESS and MORTALITY of the DISTRICT JAILS of the EASTERN SU B-BIVISION of the AREA included under the ADMINISTRATION of the NORTH-WESTERN BROVINCES, during the TEN YEARS from 1867 to 1876. [The Jails included in this Ag-gregate are shown in the Mortality Table of the series, No. LV. ] o <r o o Causes op Deaths. ^ r-( o G) ^ >5 fee MONTHS. of the A . of each Mor umber Daily aily Sick pe Deaths. 000 of Stren, y Diseases. ases. ulmonalis. id Ansemia. d Accidents, CD 3 Aggregate Strength Average N Number D Strength Number of Died per 1, Cholera M O P. i Fevers. Apoplexy. Dysentery. Hepatitis. Spleen Dis( Respirator Heart Dise Phthisis P Dropsy. Scurvy. Atrophy ar Wounds an All other C January- 52,903 1,347 25-5 161 3-04 1 6 1 88 3 24 1 3 1 1 12 3 17 February 53,520 1,354 25-3 146 2-73 27 4 9 1 53 2 22 3 2 8 4 11 March 53,973 1,105 26-0 115 213 6 1 11 2 38 3 21 2 4 2 8 1 16 April 54,069 1,416 26-2 120 2-22 5 2 7 57 1 2 22 6 1 6 3 9 May 54,490 1,322 243 117 215 2 1 11 i? 42 1 2 10 5 2 14 10 June 55,811 1,283 23-0 120 2-15 3 2 9 32 26 7 10 1 5 1 5 1 18 July 56,338 1,450 25-7 159 2-82 42 8 2 49 1 3 14 1 9 1 8 5 16 August 57,057 1,715 30-1 242 4-24 41 i 13 2 119 1 11 12 1 7 4 14 6 11 September 57,843 1,912 33-1 309 5-34 34 8 181 1 3 21 2 6 21 6 26 October 57,565 2,097 36-4 315 5-47 14 13 i 202 1 6 21 7 8 21 6 16 November 56,628 1,843 32-5 317 5-60 11 21 195 2 23 2 11 5 24 1 22 December 55,515 1.609 29-0 277 4'99 1 5 i 154 i 5 35 3 8 3 2 22 6 31 186 12 121 59 1,204 9 47 235 13 74 30 3 163 39 203 Died per 1,000 of the Average Strength, For the ten years 55,476 1,563 28-2 2,398 43'22 335 •22 2-18 i-ooj 21-70 •16 •85 4-24 •24 1-33 •54 •05 2^94 •70 3-66 CAUSES OF ADMISSIONS. NUMEl OF Admissions into Hospital in EACH Month. Total admitted during the tenjears. Admitted per 1,000 of Strength. Died out of each hun- dred cases treated. Jan. Feb. March. April. May. June. July. Aug. Sept. Oct. Nov. Dec. Dengue 5 22 26 26 4 83 1-5 Cholera 91 13 10 2 5 84 89 52 23 18 2 389 7-0 47-8I Smallpox '23 42 46 38 27 10 2 1 1 8 20 218 30 550 Enteric Fever (1872—76) 1 1 1 1 1 1,744 1,117 5 -1 Fever, Intermittent 833 786 1,000 1,150 1,147 1,020 1,241 1,574 2,.3'59 2,865 16,836 303-5 1 -70 Fevers, Eemittent and Con- tinued 23 31 54 63 81 44 27 42 43 60 39 19 526 9-5 Apoplexy 1 1 3 66 125 3 4 3 2 2 210 3-8 28-10 Dysentei-y 382 234 372 311 275 247 545 958 891 778 664 535 6,192 111-6 j 11-51 Diarrhoea 195 170 280 346 265 274 395 663 536 448 410 289 4,271 77-0 Hepatitis 3 4 4 3 4 1 2 4 3 4 ■ 1 2 35 -6 25-71 Spleen Disease 56 31 25 38 46 42 38 44 39 42 50 38 489 8-8 9-61 Eespiratory Diseases 164 169 136 107 91 88 103 98 78 113 148 169 1,464 26-4 16-05 Phthisis Pulmonalis 9 8 11 12 10 13 9 6 12 8 10 7 115 2-1 6i-3S Dropsy ... 5 4 7 3 5 7 4 5 3 10 4 5 62 11 4S-S9 Atrophy and AnEemia 66 31 39 29 47 48 47 84 59 75 61 71 657 11-8 24-81 Scurvy ... 2 1 2 1 1 1 3 15 5 6 37 -7 8-11 Kheumatism 43 45 56 59 ■47 55 59 54 65 70 66 69 68S 12-4 Venereal Diseases ... 105 85 117 120 127 115 134 111 100 108 107 76 1,305 23-5 Eye Diseases 42 24. 54 101 124 62 90 94 114 60 64 35 864 15-6 1 1-SO Abscess and Ulcer ... 469 501 503 483 579 815 808 649 526 482 492 478 6,845 123-4 Wounds and Accidents 203 260 303 296 224 318 319 239 285 220 231 152 3,100 55-9 AH other Causes ... 364 371 389 360 384 339 374 347 325 345 310 308 4,216 76-0 2,989 2,889 3,412 3,532 3,552 3,630 4,350 5,140 5,520 5,755 4,438 3,400 48,607 Admitted per 1,000 of the Average Strength in each Month, 56^5 54^0 63^2 65-3 65-2 65^0 77'2 90-1 95-4 loo-o 78^4 61-2 876-2](https://iiif.wellcomecollection.org/image/b24749333_0264.jp2/full/800%2C/0/default.jpg)