Reports bringing up the statistical history of the European Army in India and of the Native Army and jail population of Bengal to 1876 : and the cholera history of 1875 and 1876, in continuation of reports embracing the period from 1817 to 1872 / by J.L.Bryden.
- James Bryden
- Date:
- 1878
Licence: Public Domain Mark
Credit: Reports bringing up the statistical history of the European Army in India and of the Native Army and jail population of Bengal to 1876 : and the cholera history of 1875 and 1876, in continuation of reports embracing the period from 1817 to 1872 / by J.L.Bryden. Source: Wellcome Collection.
Provider: This material has been provided by Royal College of Physicians, London. The original may be consulted at Royal College of Physicians, London.
273/358 (page 253)
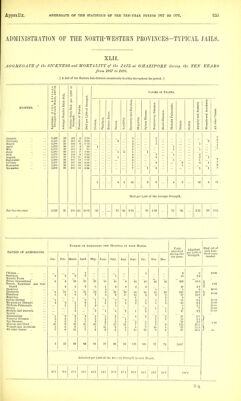
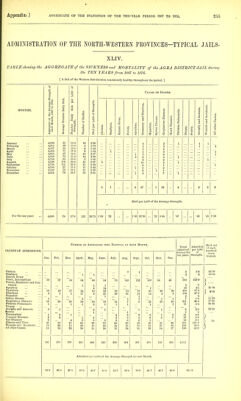
![ADMINISTRATION OE THE NORTII-WESTEEN PEOVINCES-TYPICAL JAILS. XLII. AGGBEGATE of the SICKNESS and MOBTALITYof the JAIL at GRAZIPOBE during the TEN YEABS from 1867 to 1876. [ A Jail of the Eastern Sub-division consistently healthy throughout the period. ] <U CD 'o ,000 C AUSES OE Deaths. > 5 tc Daily A S Streni 8 £ denta MONTHS. 4-1 i« o rt 'r\ cj a K a = ■3 o -a <! Average Numb Number Daily Strength. Number of Dei Died per 1,000 ^ Cholera. 'A o a Enteric Fever. t> Apoplexy. Dysentery and I Hepatitis. Spleen Disease Eespiratory Di Heart Diseases Phthisis Pulme Dropsy. Seur\y. < a >^ .a 0 < -a a C3 c 0 All other Tausf January 5,4G9 23 4-2 6 1-10 3 1 ... 2 February 5,328 21 3-9 11 2-OG 2 4 1 2 2 March ,5,288 35 6-6 6 1-13 3 1 1 1 April 5,282 30 5-7 4 76 1 2 1 2 Iilay 5,313 36 6-8 4 75 2 1 1 June 5,365 26 4-8 7 1-30 1 2 1 1 July 5,372 30 5-6 9 1-63 4 1 1 2 Auirust 5,275 37 7-0 U 2-09 1 6 1 2 1 September 5,360 36 67 10 1-87 6 1 1 October 5,387 36 6-7 li) 3-53 7 2 2 4 1 3 November 5,298 36 6-8 10 1-89 7 1 2 December 5,206 31 6-0 14 2-G9 7 1 1 1 2 1 4 2 52 2 9 4 3 12 5 17 Died per 1,000 of the Average Strength. For the ten years 5,329 31 5-8 111 20-83 •19 75 ■38 976 ■38 1^G9 ■75 •50 2-25 •93 319 CAUSES OF ADMISSIONS. NUMBBE OP AmiISSIONS INTO HoSPITAL IN EACH MONTH. Total admitted during the ten years. Admitted per 1,000 of Strength. Died out of each hun- dred cases treated. Jan. Feb. March. April. May. June. July. Aug. Sept. Oct. Nov. Deo. Cholera... 1 1 2 •4 so^oo Smallpox 2 '2 6 7 1 18 8^4 Enteric Fever Tever, Intermittent '9 4 16 25 21 18 is '9 34 30 20 18 ' 222 '41^6 Fevers, Remittent and Con- \ 1'61 tinued 4 5 2 5 1 3 3 2 2 27 5^1 Apoplexy 4 1 5 •9 40-00 Dysentery 9 ii 's 15 13 9 21 39 30 '25 15 20 215 40^3 I 18-44 DiarrhiBa 1 1 8 7 7 8 6 11 10 4 3 1 67 12 6 ) Hepatitis 1 1 2 •4 Spleen Disease 1 ' s '1 3 1 1 4 1 1 1 18 3^4 il-11 Eespiratory Diseases 4 '4 '5 6 1 5 M 2 3 _r 5 50 9^4 18-00 Phthisis Pulmonalis 1 1 1 4 1 8 1^5 50-00 Dropsy ... 1 1 1 1 4 ■7 75^00 Atrophy and Anaemia 2 2 1 5 2 1 3 1 17 32 70-59 Scurvy ... Kheumatism 1 2 3 3 '4 1 '2 4 2 3 2 27 5^1 Venereal Diseases ... 2 3 1 1 3 1 1 2 2 18 3-4 Eye Diseases 1 2 1 2 2 2 3 3 6 2 26 4^9 6-25 Abscess and Ulcer ... 10 6 19 11 10 7 12 11 7 7 3 '9 112 21-0 ! Wounds and Accidents 8 6 0 7 7 11 9 3 4 7 10 4 82 15^4 All other Causes 7 6 11 7 2 6 3 7 10 13 6 9 87 163 •ft: 6 52 94 81 78 93 92 112 105 72 74 1,007 Admitted per 1,000 of the Aver igo strength in each Month. Wl 9^8 17^8 18^7 15^2 14-5 173 17^4 20-9 19^5 13^6 14^2 189^0](https://iiif.wellcomecollection.org/image/b24749333_0275.jp2/full/800%2C/0/default.jpg)