Reports bringing up the statistical history of the European Army in India and of the Native Army and jail population of Bengal to 1876 : and the cholera history of 1875 and 1876, in continuation of reports embracing the period from 1817 to 1872 / by J.L.Bryden.
- James Bryden
- Date:
- 1878
Licence: Public Domain Mark
Credit: Reports bringing up the statistical history of the European Army in India and of the Native Army and jail population of Bengal to 1876 : and the cholera history of 1875 and 1876, in continuation of reports embracing the period from 1817 to 1872 / by J.L.Bryden. Source: Wellcome Collection.
Provider: This material has been provided by Royal College of Physicians, London. The original may be consulted at Royal College of Physicians, London.
274/358 (page 254)
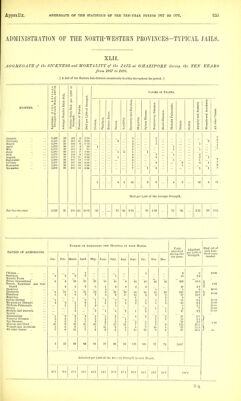
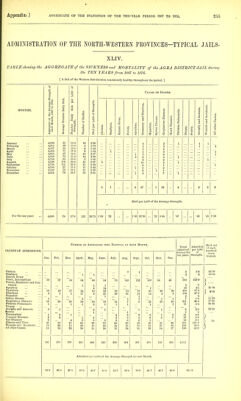
![ADMINISTRATION OF THE NORTH-WESTERN PROVINCES-TYPICAL JAILS. XLIII. AGGREGATE of the SICKNESS and 3I0BTALITY of the JAIL at GORUCKPOBE during the TEN YEARS from 1867 to 1876. [ A Jail of the Eastern Sub-division consistently unhealthy throughout the period. ] Strength 3. 1,000 of Causes of Deaths. CB p< S) 8 MONTHS. ^ CO T—I Daily Sick Strer 1 n* s dents Aggregate of the of each Month, Average Number' Number Daily ; Strength. Number of Death Died per 1,000 of' Cholera. Smallpox. Enteric Fever. Fevers. w ■& o p< < s 'C S >> p Hepatitis. Spleen Disease. Respiratory Disea Heart Diseases. • Phthisis PulmonE - Dropsy. ] 1 Scurvy. Atrophy and Ana Wounds and Aco^ All other Causes.] January 6,581 200 30-4 26 3-95 1 16 1 2 1 3 1 1 February 6,655 213 32-0 30 4-51 2 16 i 5 1 1 2 2 March 6,645 205 30-9 18 2-71 1 3 11 i 2 April 6,456 238 36-9 34 5-27 i 5 18 1 2 3 3 May June 6,377 208 32-6 26 4-08 4 13 1 6 1 6,211 183 30-3 16 2-42 1 8 2 1 2 July August September 6,391 251 393 59 9-23 31 1 14 1 3 1 '4 6,607 324 49-0 63 9-54 6 i 1 36 i 6 6 1 1 3 6.795 339 49-9 119 17-51 17 1 83 1 2 4 2 3 5 October 6,893 340 49-3 70 10-16 3 64 1 7 1 3 1 November 6,751 279 41-3 90 13-33 11 3 69 2 1 2 1 6 1 4 December .„ 6,575 247 37-6 67 8-67 43 i 1 3 1 6 1 72 4 21 373 5 18 33 4 11 6 38 2 20 For the ten years Died per 1,000 of the Average Strength. 6,678 253 38-5 607 92-28 1095 •61 3-19 56-70 -76 2-74 6-02 •61 1^67 •91 5-78 •30 3-04 'causes of ADMISSIONS. NtJMEEB OE Admissions into Hospital in each Month. Total admitted during the ten years. Adriiitted per 1,000 of Strength. Died out of each hun- dred cases treated. Jan. Feb. March. April. May. June. July. Aug. Sept. Oct. Nov. Dec. Cholera Smallpox Enteric Fever Fever, Intermittent Fevers, Remittent and Con- tinued Apoplexy Dysentery Diarrhoea Hepatitis Spleen Disease Respiratory Diseases Phthisis Pulmonalis Dropsy Atrophy and Ansmia Scurvy Rheumatism Venereal Diseases Eye Diseases Abscess and Ulcer Wounds and Accidents All other Causes ... 7 io3 7 '53 37 5 18 ' 2 22 'l4 5 10 64 26 47 ' 3 '96 5 '47 29 2 7 15 1 1 4 ' 4 10 3 69 38 42 3 14 i37 3 92 51 2 16 1 ' 9 '10 9 1 77 52 51 19 159 25 '77 117 1 5 14 3 15 '18 9 4 72 47 57 '18 i42 12 '63 64 ' 8 13 2 '22 14 11 11 77 26 44 ' 7 137 1 'ei 56 1 3 17 1 2 14 '16 7 4 57 61 34 69 1 213 4 200 108 ' 7 24 2 10 '12 8 4 89 45 46 13 1 301 7 3CO 166 1 8 23 1 18 14 9 11 67 32 37 28 321 9 204 151 1 10 15 1 12 16 8 10 62 47 46 5 319 6 260 124 e 24 2 16 12 14 4 62 39 34 18 1 i'ss 11 185 114 '7 8 2 ii 13 6 8 66 22 52 1 8 i'i4 4 130 71 1 5 14 1 24 e 6 2 43 16 33 137 79 '2^230 94 '1^672 1,088 7 73 201 14 8 177 '149 102 72 795 451 623 20-8 12-0 '339-0 14- 3 254-2 165-4 11 11-1 30-6 2-1 1-2 269 22-6 15- 5 10-9 120-9 63-6 79-5 52-65 5'06 I -90 1 13^51 71-43 24-86 16-42 78-57 75-00 21-47 1 1-24 420 376 528 642 527 479 842 1,009 1,001 867 702 479 7,872 Admitted per 1,000 of the Average Strength in each Month. 63-8 56-5 79-5 99-4 82-6 77-1 131-7 152-7 147-3 125-8 104-0 72-9 11967](https://iiif.wellcomecollection.org/image/b24749333_0276.jp2/full/800%2C/0/default.jpg)