Reports bringing up the statistical history of the European Army in India and of the Native Army and jail population of Bengal to 1876 : and the cholera history of 1875 and 1876, in continuation of reports embracing the period from 1817 to 1872 / by J.L.Bryden.
- James Bryden
- Date:
- 1878
Licence: Public Domain Mark
Credit: Reports bringing up the statistical history of the European Army in India and of the Native Army and jail population of Bengal to 1876 : and the cholera history of 1875 and 1876, in continuation of reports embracing the period from 1817 to 1872 / by J.L.Bryden. Source: Wellcome Collection.
Provider: This material has been provided by Royal College of Physicians, London. The original may be consulted at Royal College of Physicians, London.
275/358 (page 255)
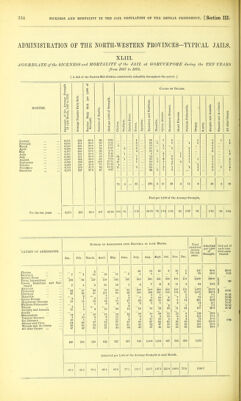
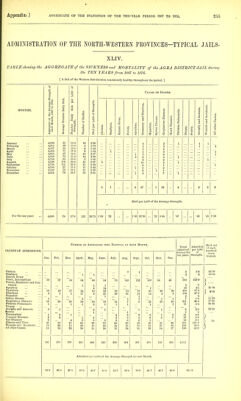
![ADMINISTRATION OF THE NORTH-WESTERN PROVINCES-TYPICAL JAILS- XLIV. TABLEsJioioing the AGGBEGATEof the SICKNESS and MORTALITY of the AGRA DISTRICT JAIL durinr, the TEN YEARS from 1867 to 1876. [ A Jail of the Western Sub-division consistently healthy throughout the period. ] trength of 1,000 of Causes oj Deiths. M !>. lit 00 p. Sj C3 i-l 53 o (>> c 8 MONTHS. > *' <^ ' Dai CB .a •BIUI, ident la tr. <1 Average Number Number Daily Strength. Number of Deatl Died per 1,000 of Cholera. Smallpox. Enteric Fever. Fevers. p, •a Dysentery and Di Hepatitis. Spleeu Disease. o o % <D OS Heart Diseases. Phthisis Pulmon; Dropsy. Scurvy. Atrophy and Anoi Wounds and Acci CO 3 C3 o < January 4,536 61 13-4 10 2-20 4 3 1 1 1 February 4,015 69 15-0 8 1-73 1 3 1 '3 March 4,537 GO 13-2 6 1-32 1 5 April 4,470 77 17-2 6 1-34 1 1 3 i May 4,608 67 14-5 10 2-17 i 2 C 1 June 4,089 72 15-4 14 2-99 3 6 4 i July 4,716 65 13-8 5 1-06 2 2 1 August 4,699 106 22-6 18 3-87 5 10 2 i September 4,726 111 23-5 11 2-33 9 1 i October 4,504 97 21-5 11 2-44 i 8 9 2 November 4,540 73 16-1 11 2-42 i 1 December 4,554 70 1G7 13 2-85 i 4 7 1 5 1 6 57 1 39 4 2 2 6 For the ten years Died per 1,000 of the Average Strength. 4,600 78 17-0 123 20-73 1-09 •22 1-30 12-39 *22 8-48 •87 •43 •43 1-30 CAUSES OF ADMISSIONS. Cholera Smallpox Enteric Fever Fever, Intermittent Fevers, Kemittent and Con- tinued Apoplexy Dysentery Diarrhoea Hepatitis Spleeu Disease Respiratory Diseases Phthisis Pulmonalis Dropsy Atrophy and Anaemia Scurvy Rheumatism Venereal Diseases Eye Diseases Abscess and Ulcer Wounds and Accidents All other Causes NuMBEK OF Admissions into Hospital iu each Month. Total admit tc during t' ten year Jan. Feb. Mar. April. May. June. July. Aug. Sept. Oct. Nov. Deo. 7 1 8 1 1 2 '30 '37 '34 84 80 54 '74 143 153 ioo 54 46 888 1 1 1 3 4 14 '' 1 19 is 19 17 24 13 23 36 73 '70 50 26 36 4114 3 1 1 17 9 21 20 61 IS 14 4 5 174 1 1 2 ' 1 ' 2 ' 1 1 ' 1 ' 1 7 15 '20 28 24 19 '18 12 7 8 22 20 28 221 1 1 1 3 1 1 1 1 1 11 3 ' 1 ' 2 ' 1 ' ' 1 ' 1 9 1 ' ' 1 1 ■ 3 1 ' 2 2 ' 3 ' 0 ' 1 2 21 2 5 ' 1 ' 5 2 3 4 6 2 7 37 2 ' 4 3 3 ' 3 2 6 2 3 28 45 '52 51 55 39 63 60 60 43 40 '41 '46 585 13 20 11 23 15 20 15 15 1-^ 12 21 16 193 11 12 22 19 11 16 15 24 15 23 14 17 199 145 170 170 255 206 225 239 404 331 278 185 205 2,813 Admitted per 1,000 of Strength. Admitted per 1,000 of the Average Strength in each Month. 1-8 •4 193^0 ■7 4-1 87-8 37-8 •4 1- 5 48-0 2- 4 2-0 -4 4-6 8-0 6-1 127-2 42- 0 43- 3 32-0 36-8 57-0 41-7 70-0 6f7 40-7 45-0 611-5](https://iiif.wellcomecollection.org/image/b24749333_0277.jp2/full/800%2C/0/default.jpg)