Reports bringing up the statistical history of the European Army in India and of the Native Army and jail population of Bengal to 1876 : and the cholera history of 1875 and 1876, in continuation of reports embracing the period from 1817 to 1872 / by J.L.Bryden.
- James Bryden
- Date:
- 1878
Licence: Public Domain Mark
Credit: Reports bringing up the statistical history of the European Army in India and of the Native Army and jail population of Bengal to 1876 : and the cholera history of 1875 and 1876, in continuation of reports embracing the period from 1817 to 1872 / by J.L.Bryden. Source: Wellcome Collection.
Provider: This material has been provided by Royal College of Physicians, London. The original may be consulted at Royal College of Physicians, London.
277/358 (page 257)
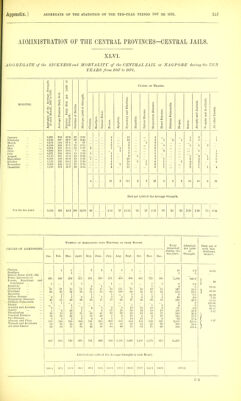
![ADMINISTRATION OF THE CENTRAL PROVINCES-CENTRAL JAILS. XLVI. AGGREGATE of the SICKNESS and MORTALITY of the CENTRAL JAIL at NAGPORE during the TEN YEARS from 1867 to 1876. a 1,000 of Causes OP Deaths. MONTHS. ta CO 61)'' B O |S ■<J 00 < Average Number Daily Sicli. Number Daily Sick per Strength. Number of Deaths. Died per 1,000 of Strength. Cholera. Smallpox. Enteric Fever. Fevers. Apoplexy. Dysentery and Diarrhoea. Hepatitis. Spleen Disease. Bespiiatory Diseases. Heart Diseases. Phthisis Pulmonalis. Dropsy. Scurvy. 3 a <i a a >j P. p Wounds and Accidents. All other Causes. 1 January February Slarch April May June July August September October November December 8,291 8,246 8,232 8,230 8,304 8,296 8,231 8,110 8,028 8,116 8,090 8,168 .389 327 305 289 275 278 290 307 489 523 446 373 40-9 397 37-1 35-1 3:!-l 33-5 30-0 45-3 60-9 64-4 55-1 457 22 20 8 15 13 7 15 24 43 43 29 29 2-65 2-43 ■97 1-85 1-57 •84 1- 82 2- 96 5'36 5-30 3- 58 3-55 2 i 1 2 1 1 3 1 1 1 1 4 2 4 l 1 1 12 10 3 2 3 ] 7 9 20 IS 15 11 1 1 l 1 1 4 2 3 5 6 1 1 4 3 6 2 5 l l 2 l 1 1 1 l ' 1 1 1 l l G 4 2 2 2 1 1 1 2 3 2 5 1 '2 1 2 1 1 1 1 5 5 6 5 4 4 21 3 111 2 3 43 8 2 2 18 18 C 28 Died per 1,000 of the Average Strength. For the ten years 8,195 363 44-3 268 32-70 •49 2-56 -37 13-54 •24 •37 5-13 •97 •24 •24i 2-20 2-20 -73 3-42 CAUSES OF ADMISSIONS. NUMBEE GIT ADMLSSIONS INTO HOSPITAL IN EACH Mo}fIII. Total Admitted Admitted Per 1,000 of Streugth. Died out of each hun- dredcases treated. Jan. Feb. Mar. April. May. •June. •Tuly. Aug. Sept. Oct. Nov. Dec. during the ten years. Cholera Smallpox Enteric Fever (1872—76) ... Fever, Intermittent Fevers, Kemittent and Continued ... Apoplexy Dysentery Diarrhoea Hep.Ttitis Spleen Disease Respiratory Diseases Phthisis Pulmonalis Dropsy Atrophy and A nsemia Scurvy Kheumatism ... Venereal Diseases Eye Diseases ... Abscess and Ulcer -Wounds and Accidents ... All other Causes 398 1 31 60 2 40 1 8 1 26 16 8 173 62 90 1 296 27 30 2 1 18 1 g 23 16 4 143 36 84 1 1 263 1 18 36 ] 4 30 1 20 13 23 5 195 38 77 312 '17 33 3 36 3 1 21 5 8 153 27 70 2 281 2 16 55 1 4 23 4 33 13 4 191 41 GO 3 228 1 15 35 1 15 5 3 .35 20 4 215 33 56 1 311 1 38 68 L 2 20 2 15 30 7 5 200 35 64 1 450 111 108 3 33 ' s 23 39 6 5 ls3 35 90 1 900 1 71 68 1 2 27 1 10 69 29 17 14 154 38 73 895 '40 45 1 6 36 12 34 24 6 23 183 33 73 725 1 1 52 41 1 8 36 1 10 10 43 fi 7 110 22 71 498 1 ii 45 1 4 35 1 3 18 22 10 6 127 20 69 10 1 5,586 8 4 447 G24 9 40 349 2 4 67 190 343 145 03 2,057 410 888 1-2 1 ' 081-6 1-0 -5 54-5 76-1 1-1 4-9 42-0 '2 '5 8-2 23-2 41-0 17-7 11-4 251-0 50-0 108-4 4*100 1 -38 75-00 J- 10-36 2222 7-50 12-03 100-00 50-00 20-87 9-47 1 1-07 907 688 728 691 741 669 830 1,101 1,466 1,410 1,175 871 11,277 Admitted per 1,000 of the Average Strength i n each Month. 109 4 83-4 88-4 84-0 89-2 80-C 1 100-8 135-8 183-6 173-7 115-2 106-6 1376-1](https://iiif.wellcomecollection.org/image/b24749333_0279.jp2/full/800%2C/0/default.jpg)