Reports bringing up the statistical history of the European Army in India and of the Native Army and jail population of Bengal to 1876 : and the cholera history of 1875 and 1876, in continuation of reports embracing the period from 1817 to 1872 / by J.L.Bryden.
- James Bryden
- Date:
- 1878
Licence: Public Domain Mark
Credit: Reports bringing up the statistical history of the European Army in India and of the Native Army and jail population of Bengal to 1876 : and the cholera history of 1875 and 1876, in continuation of reports embracing the period from 1817 to 1872 / by J.L.Bryden. Source: Wellcome Collection.
Provider: This material has been provided by Royal College of Physicians, London. The original may be consulted at Royal College of Physicians, London.
279/358 (page 259)
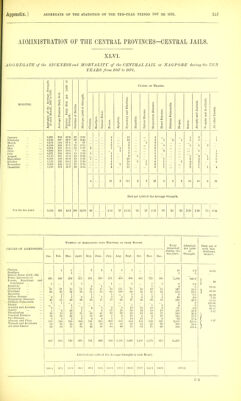
![ADMINISTRATION OF THE CENTHAL PEOVINCES-CENTRAL JAILS. XLVIII. AGGREGATE of the SICKNESS and MORTALITY of the CENTRAL JAIL at RAIRORE during the TEN YEARS from 1867 to 1876. Strength G. 1,000 of Causes of Deaths. ID ^ E O 6D rt MONTHS. > ^ <D - a ^ a 8 .a 1 a « a of th onth a >^ '3 Q o o R 3 0 ci 5 a 0 S a <! ■0 < 6c cS Gj o 3 60 ber D ■ength. o p. M 0 0 CD >, 1-1 g 3 'a >^ 1^ 3 a Ch a a (3 a 0 t- S-3 a o .a 'a a a QJ t> CJ p. 0 p- a c 0 ■3. & 0 0 < •< s to |4 <! w to M w p-l P to January 3,797 206 54-3 9 2-37 5 1 2 1 February 3,811 185 48-5 12 315 2 4 1 3 March 3,838 175 45-6 15 3-91 2 6 '2 2 3 April 3,819 175 45-5 8 2-08 2 2 2 1 i May 3,S0.-> 167 43-2 5 1-29 2 1 2 June 3,911 151 38-6 5 1-28 1 3 i July / ... 4,010 164 40-6 8 1-98 3 2 3 August 4,125 233 56-5 22 5-33 '3 3 10 1 2 3 Septenaber 4,065 277 68-1 29 7-13 6 16 2 3 2 October 4,057 328 80-8 24 5-92 3 13 1 1 i 1 4 November 4,005 339 83-4 24 5-90 3 8 1 2 2 1 4 '3 December 3,87G 270 69-7 17 i-39 10 2 1 2 4 23 1 ... SO 1 6 14 1 3 28 1 17 For the ten years Died per 1,000 of the Average Strength. 3,942 223 56-6 178 45-15 1-02 5-84 20'30 •25 1-52 3'55 ■25 ■76 7-10 •25 4-31 CAUSES OF ADMISSIONS. NuMBBE OP Admissions into Hospit.vl in EACH Month. Total admitted during the ten years. Admitted per 1,000 of Strength. Died out of each hun- dred cases treated. Jan. Feb. March. April. May, June. July. Aug. Sept. Oct. Nov. Dec. Cholera 1 7 8 2^0 50-00 Smallpox i '3 1 1 0 1-5 Enteric Fever ... 5'cl^9 Fever, Intermittent 105 108 123 107 132 130 149 206 252 383 309 260 2,215 Fevers, Bemittent and Con- 1 1-00 tinued Apoplexy Dysentery i ■ y 8 3 3 10 8 9 20 14 96 24-4 is 8 Vi 6 '13 20 60 39 20 17 11 22a Diarrhcta 31 11 25 30 34 2-4 70 1-23 92 58 43 30 580 147-1 1 9-00 Hepatitis 1 1 -5 SO-00 Spleen Disease i 1 1 1 1 3 '4 1 1 14 3-6 Eespiratory Diseases 9 6 13 9 6 3 8 4 3 8 6 5 80 20^3 7-.50 Phthisis Pulmonalis 3 2 1 1 1 2 3 3 1 1 18 4^6 77-78 Dropsy 1 1 •3 10000 Atrophy and Anaemia 9 li ' 8 's 10 4 8 6 15 13 31 13 13(i 34^5 20-59 Scurvy 1 1 1 4 9 3 19 4^8 ■ 15-79 Kheumatism ... 21 11 27 16 22 is ]7 10 22 21 19 14 218 65^3 Venereal Diseases 4 2 4 8 8 8 9 3 7 4 6 68 W3 Eye Diseases' ... 4 6 4 16 13 7 7 11 5 9 7 4 93 33-6 Abscess and Ulcer 67 04 63 59 72 88 78 75 64 79 75 59 833 211-3 Wounds and Accidents ... 20 25 31 23 17 10 28 21' 25 11 12 29 252 63-2 All other Causes 49 43 63 51 52 13 21 64 33 49 47 55 598 151-7 3*3 311 373 338 373 361 451 603 573 694 £96 444 5,-105 Admitted per 1,000 of tha Average Strength in each Month. 90^3 81^G 97-2 87^8 97^8 92-3 lire 146-2 Ml-0 171-1 1460 114'G 1386^4](https://iiif.wellcomecollection.org/image/b24749333_0281.jp2/full/800%2C/0/default.jpg)