Report of the Medical Officer of Health for the Colony on the public health ... / Cape of Good Hope.
- Cape of Good Hope (South Africa). Department of Public Health.
- Date:
- [1908]
Licence: Public Domain Mark
Credit: Report of the Medical Officer of Health for the Colony on the public health ... / Cape of Good Hope. Source: Wellcome Collection.
17/202 page 13
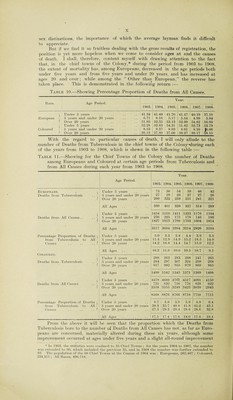
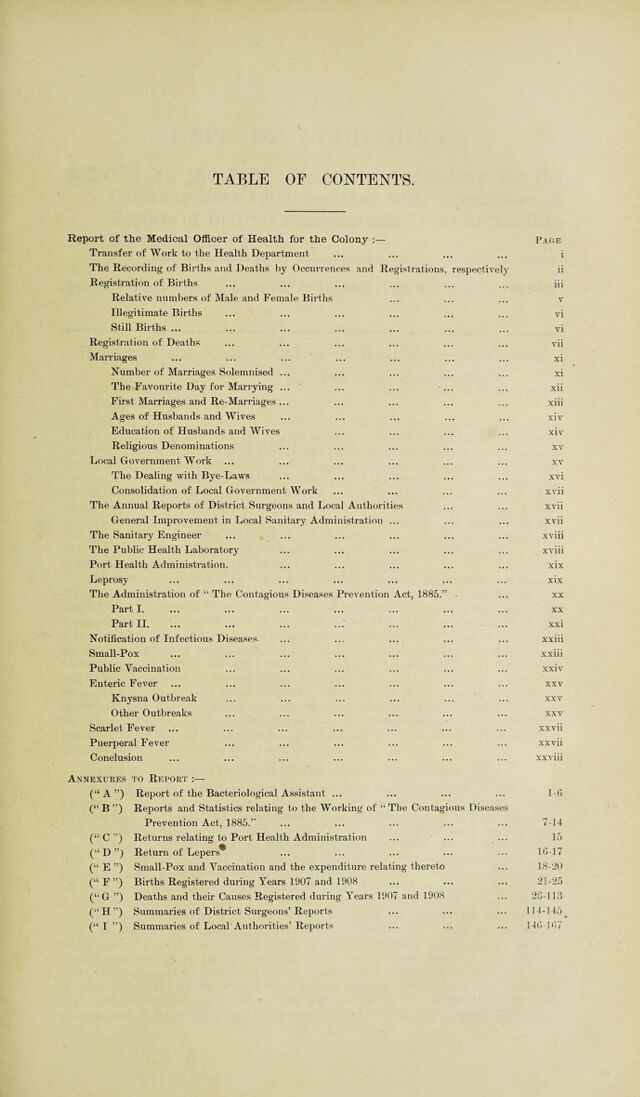
![Table 13.—Continued. Total Marriages and Percentage ■ Total for Proportion of Marriages Sun. Mon. Tues. Wed. Thur. Fri.' Sat. Week ended during each Month. Saturday. T r 61 82 1 37 11 4 3 198 (portion) June. 12 69 59 29 8 5 4 186 Total . . . . . . 931 ^ 15 37 76 33 16 8 17 202 Percentage Proportion .. 9.85 | 8 66 82 24 13 5 10 208 L 11 45 81 137 portion) , . 30 10 3 10 53 (portion) July. 10 50 75 36 25 6 9 21 1 Total .. .. .. 734J 6 43 65 31 13 2 1 1 171 Percentage Proportion . . 7.77 ' 5 62 54 25 13 5 10 174 L 10 38 52 16 7 2 125 (portion) t f 8 8 (portion) August. 7 51 62 29 12 4 7 172 Total . . . . . . 778 ] 17 39 63 28 10 3 3 163 5 62 82 26 9 3 3 190 Percentage Proportion . . 8.24 j 13 49 65 28 12 8 9 184 L 9 52 61 (portion) q r September. io 57 ' 26 21 3 6 113 (portion) 53 63 23 28 2 4 183 Total . . . . . „ 815 7 2 '68 72 29 17 1 2 191 Percentage Proportion . . 8.63 0 53 79 17 4 4 5 162 l 4 44 86 32 166 (portion) „ r 21 5 9 35 (portion) October. 9 67 59 34 20 14 11 214 Total .. .. .. 768J 13 48 55 37 13 12 10 188 Percentage Proportion . . 8.13 j 11 53 66 25 10 3 9 177 L 4 50 66 19 7 2 6 154 r 9 41 65 18 7 7 4 151 November. 12 53 48 34 7 2 5 161 Total . . . . . . 686 9 41 43 25 12 5 9 144 Percentage Proportion . . 7.26 19 47 48 32 10 4 9 169 L 11 50 61 (portion) r 47 22 12 5 4 90 (portion) December. 13 40 54 20 14 5 3 149 Total . 837 8 71 46 20 12 2 8 167 Percentage Proportion . . 8.86 j 16 65 76 31 9 12 16 225 t 14 48 105 28 11 . . 206 (portion) Total.9,446 493 2,758 3,467 1,437 617 279 395 9,446 Percentage Proportion of Marriages El taking place on the different Days of the Week 5.22 29.20 36.70 15.21 6.53 2.96 4.18 First Marriages and Re-Marriages. The following Table 14 shews at a glance, in respect of the 9,446 marriages solemnised in 1908, the previous state of the contracting parties as to whether they were bachelors, spinsters, widows, widowers or divorced. Table 14.—Showing the conjugal condition of the persons who married during the year 1908 Husbands. Wives. Spinsters. Widows. Divorced. Total. Bachelors 7.726 270 28 8,024 Widowers 721 219 9 949 Divorced 21 2 1 24 Total 8,468 491 38 8,997 Previously both married defacto 449 9.441) Of the 9,446 marriages, 949, or 10 per cent, were of widowers, and only 491 or 5.2 per cent, of widows. In England and Wales, in the year 1907, the pro¬ portions, respectively, were 8.4 and 6.1 per cent. In this Colony, as in other coun¬ tries, widows re-marry much less frequently than do the widowers. This is made more markedly evident when it is remembered that, at the last Census, in 1904, there were in the Colony Proper 42,530 widows as compared with only 15,293 widowers. [G. 43—1909.]](https://iiif.wellcomecollection.org/image/b31482041_0017.jp2/full/800%2C/0/default.jpg)