English vaccination and small pox statistics : with special reference to the report of the Royal Commission, and to recent small pox epidemics / by Noel A. Humphreys.
- Humphreys, Noel A.
- Date:
- [1897]
Licence: Public Domain Mark
Credit: English vaccination and small pox statistics : with special reference to the report of the Royal Commission, and to recent small pox epidemics / by Noel A. Humphreys. Source: Wellcome Collection.
5/38 page 4
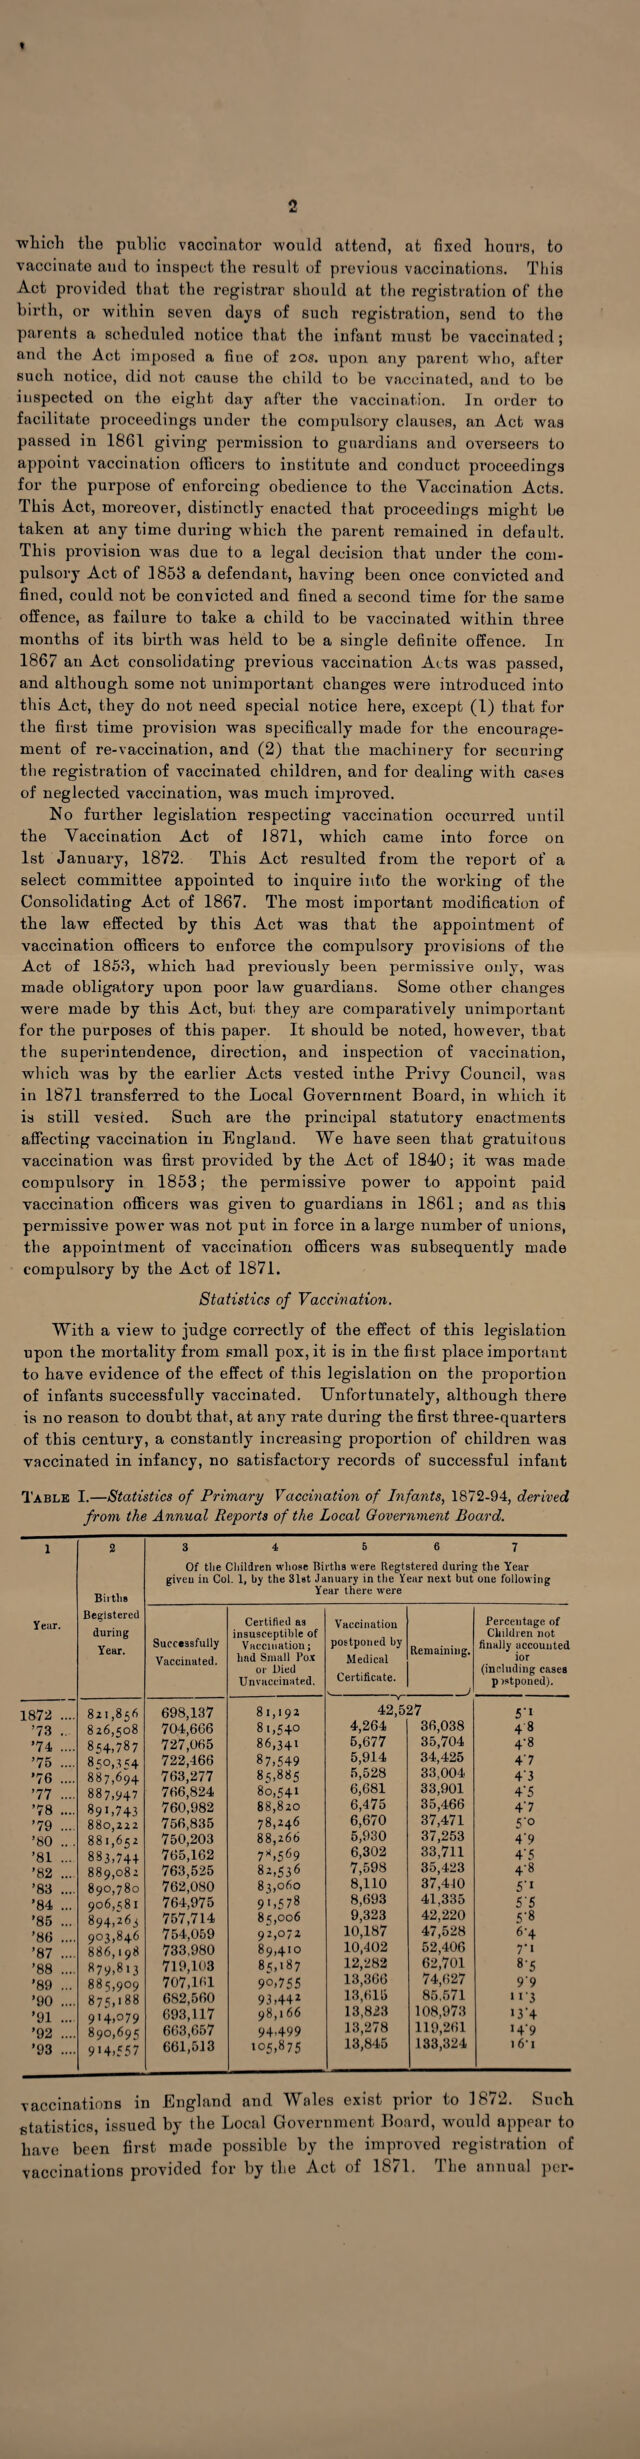
![s centage of children born and not finally accounted for as to vaccina¬ tion, including cases of postponement, was almost stationary during the twelve years 18/2-83, and only ranged between ij-i in 1872, and 4 3 in 1876. After 1883 the percentage unaccounted for rose steadily; at first slowly to 9*9 in 1889, and more rapidly after the appointment of the Rojal Commission, to 11*3 in 1890, 13-4 in 1891, i4‘9 in 1892, and 16* 1 in 1893. It may here be noted that the proportion of cases of children in Scotland whose vaccination was not finally accounted for, has since 1872 been constantly and considerably lower than in England, and has shown a very slight increase in recent years—affording ground for the conclusion that the opposition to vaccination, which has caused so large a decline in the proportion of vaccinations in England, does not exist, or has been comparatively inoperative in Scotland. Official Statistics of Small Pox Mortality in England. Let us now examine the English official statistics of small pox mortality, commencing with 1838, the first complete year of civil registration. Unfortunately the causes of death in England and Wales in the four years 1843-46 have never been classified, which makes it necessary to omit all reference to those years. During Table II.—Annual Rate of Mortality per Million Living from Small Pox in England and Wales, 1838-96. [Dr. Ogle’s table, “First Report,” p. 114.] Year. Deaths. Year. Deaths. Year. Deaths. Year. Deaths. 1838. 1,064 1852 ... 401 1867 .... 116 1881 .... 124 ’39. 589 ’53 .... 171 ’68 ... 93 ’82 .... 54 ’54 .... 151 ’69 ... 70 ’83 .... 39 1810. 661 ’55 ... 134 ’84 ...-. 87 ’41. 400 ’56 .... !I9 1870 .... ii 6 ’85 .... 107 ’42. » 168 ’57 ... 204 ’71 ... >,015 ’86 .... 13 ’43. f ’58 . 332 ’72 .... 824 ’87 .... 2 I ’44. ? ’59 ... J95 ’73 .... IOI ’88 .... 4° ’45. ? ’74 .... 9 * ’89 .... 4 ’46. ? 1860 ... 118 ’75 ... 40 ’47. 246 ’61 .... 66 ’76 ... 103 1890 .... 4 ’48. 397 ’62 ... 80 ’77 .... 178 ’91 .... 5 ’49. 264 ’63 .... 289 ’78 .... 79 ’92 .... 19 ’64 .... 367 ’79 .... 25 ’93 .... 53 1850. 26a ’65 .... 303 ’94 ... 31 ’51. 389 ’66 .... 141 1880 .... 29 ’95 ... 10 Note.—The deaths in this table include those referred to chicken pox. The facts are not available for the four years 1843-46. the twelve years 1838-42, and 1847-53, for which official records exist, prior to vaccination being made compulsory, the annual death-rate from small pox averaged 408 per million, and ranged between 1,064 in 1838, and 168 in 1842. It may be stated that there is good ground (based upon the statistics for London) for believing that the mean small pox death-rate in the four years 1843-46, for which no tabulated records exist, somewhat exceeded the mean rate in the twelve years 1838-53, for which the Registrar- General has published the results. Compulsory vaccination came into operation in 1854, and although no effectual means of en¬ forcing the obligation existed until after the Act of 1871 took effect, there is conclusive evidence that a marked increase of primary vaccination took place in 1854. During the forty-two years of compulsory vaccination the annual death-rate from small pox averaged 126 per million, although this period included the remarkable epidemic in 1871-72; indeed, during the twenty years 1877-96, the mean annual rate has been only 42 per million. The range of mortality during this period of forty-two years was from 1,012 and 821 per million in 1871 and 1872, to o’8 and o-6 per million in 1889 and 1890. Thus, judged by the whole available [statistics of the Registrar-General, the mean mortality from small pox declined from 408 per million in the twelve years prior to compulsory vaccination, to 126 per million in the forty- two years since vaccination was made compulsory, notwith¬ standing the epidemic of 1871 72 ; showing an average decline of more than two-thirds, or 69 per cent. Dr. William Ogle, in his valuable evidence before the Royal Commission, subdivided the period of compulsory vaccination into tWo:—-(1) “Vaccination obligatory but not efficiently enforced, “ 1854-71; ” and (2) “Vaccination obligatory, but more efficiently “ enforced by vaccination officers, 1872-87.” Those who imparti¬ ally study the evidence given before the Commission, and the statistics of the subject, can scarcely avoid the conclusion that the passing of the Act of 1871 marks a decided epoch in the inter-relation of small pox and vaccination, not only on the ground of the compulsory appointment of vaccination officers, but also because of the marked improvement in the machinery for securing the effective action of these officers, which provided the means for a satisfactory registration of successful vaccinations, and of cases unaccounted for. Dr. Ogle’s subdivision drew the line after the year 1871, because the Act of that year did not take effect till 1872, and thus included this year of heaviest small pox mortality in the period of inefficiently enforced obligation, 1854-71. Dr. Ogle with his evidence gave a table showing that in these eighteen](https://iiif.wellcomecollection.org/image/b3055696x_0006.jp2/full/800%2C/0/default.jpg)