Effect of alcohol on psycho-physiological functions / by Walter R. Miles.
- Miles, Walter R. (Walter Richard), 1885-1978.
- Date:
- 1918
Licence: In copyright
Credit: Effect of alcohol on psycho-physiological functions / by Walter R. Miles. Source: Wellcome Collection.
138/158 (page 126)
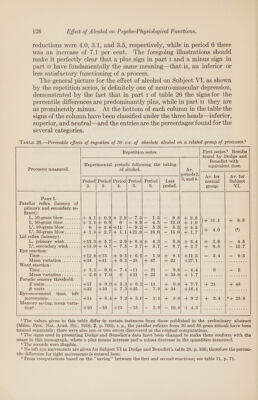
![reductions were 4.0, 3.1, and 3.5, respectively, while in period 6 there was an increase of 7.1 per cent. The foregoing illustrations should make it perfectly clear that a plus sign in part 1 and a minus sign in part 1 have fundamentally the same meaning—that is, an inferior or less satisfactory functioning of a process. The general picture for the effect of alcohol on Subject VI, as shown by the repetition series, is definitely one of neuro-muscular depression, demonstrated by the fact that in part 1 of table 26 the signsfor the percentile differences are predominantly plus, while in part 1 they are as prominently minus. At the bottom of each column in the table the signs of the column have been classified under the three heads—infer ior, superior, and neutral—and the entries are the percentages found for the several categories. Repetition series. First series.2, Results found by Dodge and Benedict with equivalent dose. Experimental periods following the taking Processes measured. of alcohol. Avy. - oe ee pee eae Av. for Av. for Period| Period| Period| Period| Period Last » ands.) normal Subject 2. 3. 4, 5. 6. period. group. VI. Part I. Patellar reflex (latency of primary and secondary re- flexes): L, 30-gram blow........ + 4.1/+ 0.9}+ 2.9)- 7.3;-— 1.5) — 9.8] + 2.6 La 11.1 iv 0.3 L, 50-gram blow........ + 2.1/+ 0.9 0 |— 8.9}-— 4.5) — 12.0) + 1.0 : ; L’, 30-gram blow....... 0 j+ 2.6/4+11 |-— 9.2}-— 5.3) — 5.38} + 4.5 19 4.0 (3) L’, 50-gram blow....... + 1.3)/+ 2.7;+ 1.1)/+21.0)/— 16.0) — 15.0) + 1.7 Lid reflex (latency): L, primary wink....... +13.3)+ 5.7;/-— 2.9/+ 6.4/+ 4.3] — 5.8) + 5.4] + 5.9 — 4.6 L’, secondary wink..... +15.0)+ 0.7)/-— 7.5/-— 3.7)/+ 3.7| — 6.7) + 2.7; + 6.8 — 10.7 Eye reaction: dhirs os eA Lene oS eee +12.0/+13 |+ 9.5)4+ 6.2;— 1.9] + 8.1] +11.5] — 5.4 — 9.3 Mean variation........ +34 |+41 |+ 6.3)/-—25 |+ 47 + 22 +2131 1 1 kb. beeen eee Word reaction: LET G aieerot ee Sirs kk ews. 8 + 3.1/— 9.0;— 7.4;-11 |—- 21 — 9.6) — 4.4 0 -— 6§ Mean variation........ — 2.0)+ 7.0 O |+21 |+ 25 +b 35. Oiri-F 1k al i. ee oe eee oe eee Faradic sensory threshold: 7; VOPR eieos FER. ss +17 |+ 0.9/+ 5.3)/+ 6.2}— 11 + 0.9} + 7.7} + 21 + 48 BoaGS ok sh a Mere +32 {+10 |+ 7.3/+25 |— 7.9] + 24 1-10.41 0. Fo. ue oul eee ee Eye-movement time, left MOVveiwornts spas. 643 oo LS9 +14 |4+ 6.4/+ 7.2)4+ 5.0/— 2.1) + 3.0) + 9.2] + 3.4 |4+ 25.8 Memory saving, mean varia- COL Crees oes ee ee +10 j};=—10 |+13 [—15 |— 5.0] — 10.0) + 4.3] ........] ........ 1 The values given in this table differ in certain instances from those published in the preliminary abstract (Miles, Proc. Nat. Acad. Sci., 1916, 2, p. 703), e. g., the patellar reflexes from 30 and 50 gram stimuli have been treated separately; there were also one or two errors discovered in the original computations. 2 The signs used in presenting Dodge and Benedict’s data have been changed to make them conform with the usage in this monograph, where a plus means increase and a minus decrease in the quantities measured. 3 The records were illegible. 4 No left eye movements are given for Subject VI in Dodge and Benedict’s table 28, p. 166; therefore the percen- tile difference for right movements is entered here. 5 From computations based on the “‘saving’’ between the first and second reactions; see table 11, p. 71.](https://iiif.wellcomecollection.org/image/b32847117_0138.jp2/full/800%2C/0/default.jpg)