Effect of alcohol on psycho-physiological functions / by Walter R. Miles.
- Miles, Walter R. (Walter Richard), 1885-1978.
- Date:
- 1918
Licence: In copyright
Credit: Effect of alcohol on psycho-physiological functions / by Walter R. Miles. Source: Wellcome Collection.
15/158 (page 13)
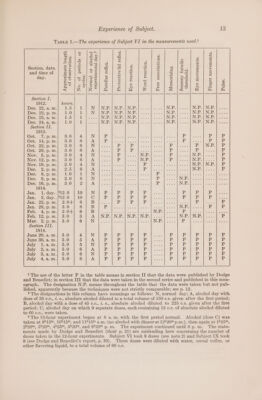
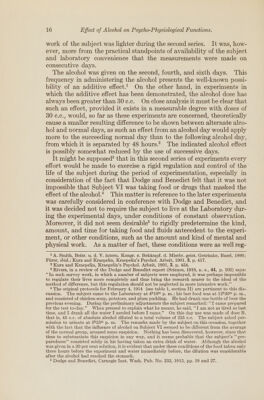
![TaBLy 1.—The experience of Subject VI in the measurements used. ; eee 5 Re gale |se| | ¥ : : 2) g ee a a aa ral : 3 Section, date, | = ; 2 be = a |= |¢4 Be a bE | > and time of ae Pit = B ep = 3 8 ee ate 5 > 3 dy. | Helydiat] & (2/28 | 2/8] eleslelel. ea | cles| ze | Sic lB) ei}8 ae z| 3 Se Siee Sie eo) Seb 2 he pee Bie pe oe, je) hte ie | Pe Pe lS fe Te Pe Section I. 1912. hours. bes. 23, asm.p- 1.5 1 NEN. LN.P. NP. N.P. N.P.| N. Dee. 22; p.m.) 1.0 1 NW {NPL N22. | NP. N.P. NP. (i NP Dec. 23, a. m. 1.5 i W.P.1 NP. | NP. N.P. NPT RE Dec. 24, a.m. 1.6 1 W.P..| N2&. UN.P: N.P- N.P. | N. Section II. 19138. Get. Ti jem.| 3.0 4 N Pe es. das ee ce Pn he P Oct. 14,p.m.| 3.0 8 A | ees eee teks Mae ao, Be 2 P Oct. 22,p.m.| 3.0 6 N Pu ae P Fr «rh xe Pat © Oct. 29, p.m.) 3.0 6 A P ase a es P hg r Nov. 5,p.m.| 3.0 4 N P W.P. ?r NP. P Nov. 12, p.m.| 3.0 6 A kd N.P. r ees Bees by Nov. 19, p.m.| 2.0 4 N oe i NLP. | NP P re. 2. p.m.) 2.5 6 A P NP. P Dec. 8, p. m. 1.6 1 N Pp Pe ; Dec. 9,p.m.| 2.0 6 N r . | SP Dec. 16, p.m.| 3.0 2 A Pr ae ws Pe 191 Jan. 1, day..|*12.0 10 N Pp . ef Le P. bu.. Jan. 2, day..|°12.0 10 C P r ? P Be ee 3 r Lae ee Jan. 22,p.m.| 2.0+] 6 B r | dan Lae 2 ee P dati. 28, p.m.) 3.0 8 B P Pak reat .|N.P 4 Feb. 4, p.m.} 2.0-+] 6 B a, NP Se are Ek oe Feb. 12, p.m.| 3.0 3 AOD NCOP LN Te sd ne ns ; PINs Ne Mar. 2,p.m.| 3.0 6 N fo WP Aa ee : Section III. 1914. June 29, a.m.} 5.0 4 N P r I P P | P % P June 30, a.m.| 5.0 5 A P P P P Ed ig P. e P July I,.a.m.j 5.0 5 N r r | r r P P P Pp July 2,a.m.} 5.0 6 A P P PY P P P r E P July 3,a.m.| 5.0 6 N P er P i r P P P P July 4,a.m.| 5.0 6 A i P P P P b r P bd 1 The use of the letter P in the table means in section II that the data were published by Dodge and Benedict; in section III that the data were taken in the second series and published in this mon- ograph. The designation N.P. means throughout the table that the data were taken but not pub- lished, apparently because the techniques were not strictly comparable; see p. 12. 2 The designations in this column have meanings as follows: N, normal day; A, alcohol day with dose of 30 c.c., t. e., absolute alcohol diluted to a total volume of 150 ¢.c. given after the first period; B, alcohol day with a dose of 45 c.c., 7. e., absolute alcohol diluted to 225 c.c. given after the first period; C, alcohol day on which 9 separate doses, each containing 12 c.c. of absolute alcohol diluted to 60 c.c., were taken. 3 The 12-hour experiment began at 8 a. m. with the first period normal. Alcohol (dose C) was taken at 9515™, 10215™, and 11515™ a.m. (no alcohol with dinner at 1220™ p.m.), then again at 1525™, 2h20™, 3h20™, 4525™, 5420™, and 6520™ p.m. The experiment continued until 8 p.m. The state- ments made by Dodge and Benedict (their p. 21) are misleading here concerning the number of doses taken in the 12-hour experiments. Subject VI took 9 doses (see note 2) and Subject IX took 8 (see Dodge and Benedict’s report, p. 30). These doses were diluted with water, cereal coffee, or other flavoring liquid, to a total volume of 60 c.c.](https://iiif.wellcomecollection.org/image/b32847117_0015.jp2/full/800%2C/0/default.jpg)