Fifth scientific report on the investigations of the Imperial Cancer Research Fund / by E.F. Bashford.
- Date:
- 1912
Licence: In copyright
Credit: Fifth scientific report on the investigations of the Imperial Cancer Research Fund / by E.F. Bashford. Source: Wellcome Collection.
118/132 (page 82)
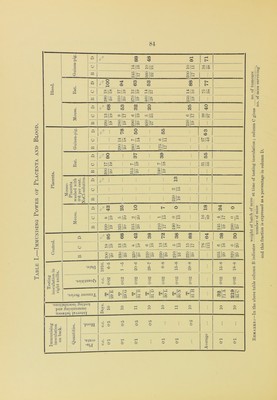
![CONTROL. Control Untreated Mice. Average weight 15'0 grms. MOUSE PLACENTA. Mice treated with Mouse Placenta 01 c.c. Average weight 16-8 grins. RAT PLACENTA. Mice treated with Rat Placenta 0T c.c. Average weight lo-0 grms. MOUSE BLOOD. Mice treated with Mouse Blood 0-5 c.c. A verage weight 15-2 grins. RAT BLOOD. Mice treated with Rat Blood 0 5 c.c. Average weight 14-5 grms. 17/ /5 2y '31/ /5 V /6 /6 JT/ /5 <2.4/ /5 'sy /s /7/ /6 /e 17/ /5 /5/5 'r/ /6 'll/ /6 17/£4/3 J:/T/l 4/ ZB/5/3 /g /e lry /5 '24/ /5 '31/ /5 /r/ /6 '14/ /€ 1 t f / < r 20 i / f f f 39 4 4 4 1 f f 58 I 4 c « 77 f t 2 / i t 4 t t 21 » 1 i I » 40 / i t f 4 59 ; i / t • • 78 C 4 4 4 € 3 • 1 \ • 4 % 1 22 f » * 9 » ♦ : 41 • • % • 7 60 i I f f f 79 • « 4 • t • 4 1 ( i t 23 1 1 t > 42 J t 1 f 4 * 4 % « 61 • / / 4 4 80 t 1 f # 5 1 i 1 $ 9 24 i / 9 / 43 f / 4 4 > 62 • 1 » 1 % 81 » 4 * • • 6 • 4 » % i % T 25 % 4 • • • 44 1 4 4 4 / % 1 • i • 63 I t 4 i % • 82 i 1 4 # f T 1 1 1 4 • 26 — • • • % 45 1 t % < « % 64 / 4 i 4 83 » / i I # 8 J $ r 4 $ • * 27 — — — • 46 • • 4 f • 4 • • 65 • • t • • 84 i . 1 » 1 4 ( • 9 • • 4 * 4 28 / \ — — — 47 1 4 • 9 • 4 4 •t • 66 f / 1 85 • i i 1 • 1 • 10 « I » • I 29 — — — — — 48 • • 1 » • 4 • • • 67 • « * • • 86 • • <» i 4 • • 11 4 t f 4 * # » 30 — — — — — 49 1 l ) 4 * * • 68 • • • 4 • 87 • 4 • • • n • • # 31 — — — — — 50 • > • • c • 4 69 l J ♦ 4 4 t 88 1 f f < < ( 13 • • 4 4 « 32 — — — — — 51 * 1 • * • ro i # • • ♦ 89 i 1 i i 4 1 » * 14 # / 4 4 4 33 52 I t f 1 i 71 90 • / > / / 15 » 4 4 4 • 34 — — — — — 53 • • k • 4 72 — — — — — 91 4 ( » t 16 1 • * • 35 — — — — — 54 • • % J 4 • 4 73 92 l < f 1 i 1 % 17 # • t r # 36 — —i — — — 55 — — — « % 74 — — — — — 93 1 i t 18 < P P * 4- 37 — — — — — 56 r • • • — 75 — — — — — 94 • f • « 19 — — — — — 38 — — — — 57 — — — — — 76 — — — — — 110 cm. Scale to show degree of reduction of chart. Fig. 1. Shows high degree of immunity induced by preliminary treatment witli mouse placenta, less with mouse blood, and absence of immunity after treatment with the corresponding rat tissues. [Exp. T/29 E.—The mice wore treated with placenta 0T c.c. and blood 0’5 c.c. on the 26th April, 1910 ; on the 6th May 0 02 c.c. of carcinoma was transplanted in right axilla, and on May 17tli the first charting was made.]](https://iiif.wellcomecollection.org/image/b2806186x_0118.jp2/full/800%2C/0/default.jpg)