Report on the sanitary administration of the Punjab and proceedings of the Sanitary Board for the year ... and the report on sanitary works for.
- Punjab (India). Sanitary Board.
- Date:
- [1882]
Licence: Public Domain Mark
Credit: Report on the sanitary administration of the Punjab and proceedings of the Sanitary Board for the year ... and the report on sanitary works for. Source: Wellcome Collection.
24/236 page 4
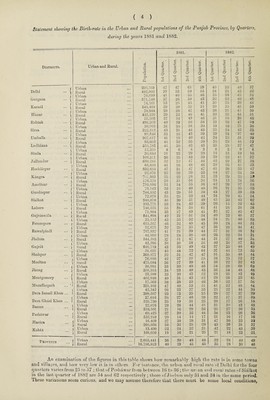
![Statement showing the Birth-rate in the Urban and Rural populations of the Punjab Province, by Quarters, during the years 1881 and 1882. Districts. Urban and Rural. Population. 1881. 188 2 1st Quarter. 2nd Quarter. 3rd Quarter. 4th Quarter. 1st Quarter. 1 2nd Quarter u o -p 3 <y n3 CO 4th Quarter. ( Urban 200,5(19 47 47 61 59 40 35 4S 57 Delhi ... i Rural 412,91(1 39 33 58 55 34 25 43 52 l | Urban 70,099 41 40 55 46 35 24 42. 52 Gurgaon ... i Rural 571,749 37 26 50 43 32 22 40 48 1 Urban 74,161 33 25 43 41 30 25 30 44 Karn&l ... } Rural 548,460 39 30 55 51 39 35 45 50 J Urban 70,944 2S 28 47 43 26 21 41 53 Hissar ... i Rural 433,239 39 32 46 45 30 25 44 51 ( Urban 55,306 37 34 49 46 31 26 36 48 Rohtak ... | Rural 498,303 40 33 58 58 33 26 47 52 l Urban 30,963 31 25 38 30 19 10 23 36 Sirsa ••• j Rural 222,312 43 31 44 43 25 24 43 53 j Urban 99,616 33 25 43 39 29 24 •37 40 Umballa ••• 1 Rural 967,617 41 2S 40 42 34 25 31 39 f Urban 83,052 44 32 55 50 35 29 44 57 Ludhiana ... l Rural 535,783 45 30 43 43 35 2S 37 47 Urban 12,305 4 6 4 3 8 3 9 4 Simla ••• \ Rural 30,640 31 23 29 29 14 13 10 16 Urban 109,311 36 25 43 39 39 23 41 57 Jullundur ••• j Rural 680,244 52 32 47 44 42 29 37 50 t Urban 68,60S 41 26 48 46 39 26 41 53 Hoshiarpur ••• j Rural S32,683 47 31 47 47 41 28 35 47 ( Urban 22,870 25 20 29 33 34 27 24 38 Kdngra ••• ^ Rural 707,969 25 23 28 32 33 29 25 33 1 U rban 176,370 39 31 54 34 24 13 24 56 Amritsar • ■ ■ j Rural 716,896 51 34 55 56 42 26 37 5S j Urban 79,113 33 21 49 40 36 21 35 53 Gurdaspur ... \ Rural 744,552 43 29 51 50 43 27 39 59 1 Urban 72,078 35 25 50 44 34 29 45 54 Sialkot ... \ Rural 940,070 46 30 51 49 45 30 43 62 ( Urban 183,771 33 24 42 39 26 15 32 45 Lahore ... j Rural 740,335 55 38 58 61 41 28 38 58 ( Urban 71,994 33 27 49 41 32 27 45 47 Gujrdnwdla ... | Ruial 541,898 42 31 51 54 40 90 OO 46 57 1 Urban 35,152 43 35 52 48 34 21 40 53 Ferozepore ... i Rural 615,367 46 32 49 45 30 24 44 51 ( Urban 52,675 32 25 35 47 36 28 44 41 Rawalpindi ... \ Rural 767,S37 41 31 39 44 37 31 36 34 ( U i ban 44,990 28 21 38 40 26 22 34 31 Jhelum ... ^ Rural 544,383 3.7 31 47 44 31 27 40 34 ( Urban 42,396 38 39 58 56 40 36 57 53 Gujrat ... | Rural 646,719 43 33 49 43 37 35 48 49 ) Urban 51,631 45 44 72 64 37 44 72 55 Sliahpur ... ] Rural 369,877 32 31 47 47 31 O0 48 44 j Urban 76.SS0 42 37 59 55 34 25 52 57 Mooltan ... ) Rural 475,084 36 27 39 41 26 22 32 43 ( Urban 36,981 33 30 48 46 34 39 60 63 Jhang ... j Rural 358,315 31 23 40 43 36 34 48 48 f Urban 23,589 33 30 43 52 2S 25 43 49 Montgomery ... 1 Rural 402,940 40 31 j 43 42 29 26 33 45 ( Urban 17,503 36 38 55 46 36 22 57 56 Muzaffargarh ... ' l Rural 321,102 47 40 53 51 41 32 48 44 j U rban 42,342 26 23 37 35 25 22 44 30 Dera Ismail Khan ... 1 Rural 399,307 23 23 35 35 29 27 37 29 ( Urban 37,616 28 27 40 39 22 17 37 39 Dera GhazI Khan ... \ Rural 325,730 25 19 31 25 20 17 26 18 Urban 22,076 29 26 44 48 31 30 43 48 Rural 310,501 21 16 29 36 25 27 36 35 PeshAwa? Urban 60,425 37 30 32 44 36 23 26 36 Rural ,,, 532,219 20 14 14 17 21 16 17 16 Urban • • • 16,409 27 30 39 31 47 30 33 32 a - J Rural 390,666 34 32 25 29 45 39 31 37 TColidt* Urban 13,490 2*2 24 32 31 42 22 43 39 ... ^ Rural 168,050 IS 16 21 25 21 18 23 j 21 Urban 2,055,441 36 30 1 4S 44 32 24 40 49 Rural ... 16,7S6,823 40 29 1 45 45 35 28 1 38 46 An examination of the figures in this table shows how remarkably high the rate is in some towns and villages, and how very low it is in others. For instance, the urban and rural rate of Delhi for the four quarters varies from 25 to 57 ; that of Peshawar from between 1G to 36 ; the un an and rural rates of Siiilkot in the last quarter of 1882 are 54 and G2 respectively ; those of Jhelum only 31 and 34 in the same period. These variations seem curious, and we may assume therefore that there must be some local conditions,](https://iiif.wellcomecollection.org/image/b3148928x_0024.jp2/full/800%2C/0/default.jpg)