Report on the sanitary administration of the Punjab and proceedings of the Sanitary Board for the year ... and the report on sanitary works for.
- Punjab (India). Sanitary Board.
- Date:
- [1882]
Licence: Public Domain Mark
Credit: Report on the sanitary administration of the Punjab and proceedings of the Sanitary Board for the year ... and the report on sanitary works for. Source: Wellcome Collection.
26/236 page 6
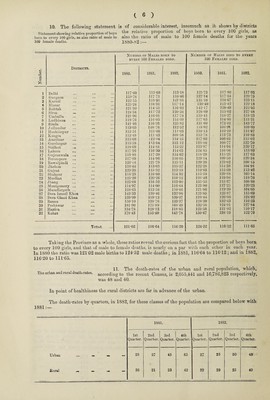
![10. The following statement is of considerable interest, inasmuch as it shows by districts Statement showiog relative proportion of boys the relative proportion of boys bon. to every 100 girls, as born to every 100 girls, as also ratio of male to 8.1SO th.6 TcttlO OI lllcilG to 100 IGIXluiG (iG&tllS lor tll6 y00.18 100 female deaths. 1880-S2 :— Number. Districts. Number of Males born to every 100 Females born. Number of Males died to every 100 Females died. 18S0. 1881. 1882. 1SS0. 1SS1. 1S82. 1 Delhi 117-60 115-60 113-1S 125-73 117-80 117-93 2 139-78 117-71 116-46 137-14 11734 120-75 s Karnal 12215 118-91 H3-S8 13110 124-67 12311 4 Hissar . > » 125-24 116-31 117-14 130 40 123-42 122-18 5 Rohtak 121-39 114-51 116-93 14217 128-49 122-95 6 Sirsa •— 124-34 117-72 120-34 128-89 115-02 127-48 7 Umballa 121-96 11601 117-78 130-41 118-27 118-23 8 Ludhiana ,,, 118-76 116-05 114-09 117 '65 114-88 113-31 9 Simla 14L46 116-26 125-82 131-69 173-31 143-77 10 Jullundur • • • 113-65 108-76 112-52 118-92 106-91 109-60 11 Hoshiarpur ... , , 11351 ] 11-06 111-03 116-13 110-19 113-97 12 Kangra • . . 113-48 111-43 108-58 115-78 113-73 116-83 13 Amritsar ... • • • 115-08 112-84 114-15 117-93 106-01 115-02 14 Gurdaspur 115-58 11304 113 12 118-86 108-77 122-70 15 Sialkot ..• ,,, 118-09 114-81 115-22 123-97 114-94 120-17 16 Lahore 4 , . 117-26 11630 114 03 124-85 116-06 115-89 17 Gujranwala ... • • * 118-88 117-39 114-62 118-29 115-25 117-63 18 Ferozepore ... 117-89 114-96 116-05 129-14 109-50 120-34 19 Rawalpindi • * • 126-14 121-78 115-11 129-38 123-62 10S15 20 Jhelum •.. 119-44 113-63 115-57 122-28 114-38 104-91 21 Gujrat ... 120-38 115-32 113-18 119-83 115-69 113-42 22 Shahpur ,, 118-28 110-60 114 92 115-50 120-88 10514 23 Mooltan t». 125-20 120-26 116-12 126-46 119-98 118-76 24 Jhang ,,. 123-OS 116 52 113-90 135-55 115-67 108-S8 25 Montgomery ... • . . 114-97 114-60 116-64 123-80 117-25 120-23 26 Muzaffargarh ... .. . 128-65 113-58 110-66 121-86 119-39 104-05 27 Dera Ismail Khan ... • . . 143-33 130-46 132-96 123-85 125-87 115-69 28 Dera Ghazi Khan • • . 139-99 139-13 139-07 139-44 126-80 124-92 29 Bannu • • • 150-10 138-76 133-37 128-39 132-43 116-53 30 Peshawar * • . 181-90 175-89 168-49 132-58 124-01 127-84 31 Hazara 134-78 128-13 118-85 123-58 121-82 110-17 32 Kohat ... 178-43 15360 143-78 150-67 138-19 122-70 TOTAt 121-02 116-64 116-20 124-52 116-12 111-65 Taking the Province as a whole, these ratios reveal the curious fact that the proportion of boys born to every 100 girls, and that of male to female deaths, is nearly on a par with each other iu each year. In 1880 the ratio was 12102 male births to 12P52 male deaths ; in 1881, 116'64 to 116T2 ; and in 1882, 116-20 to 111-65. 11. The death-rates of the urban and rural population, which, The urban and rural death.rates. according to the recent Census, is 2,055,441 and 10,786,823 respectively, was 48 and 40. In point of healthiness the rural districts are far in advance of the urban. The death-rates by quarters, in 1882, for these classes of the population are compared below with 1881:— 1881. 18S2. 1st 2nd 3rd 4th 1st 2nd 3rd 4th • Quarter. Quarter. Quarter. Quarter. Quarter. Quarter. Quarter. Quarter. Urban — 28 27 4S 65 27 28 30 48 Rural — — — 26 21 23 42 20 20 23 40](https://iiif.wellcomecollection.org/image/b3148928x_0026.jp2/full/800%2C/0/default.jpg)