Suicide : an essay on comparative moral statistics / by Henry Morselli.
- Enrico Morselli
- Date:
- 1881
Licence: Public Domain Mark
Credit: Suicide : an essay on comparative moral statistics / by Henry Morselli. Source: Wellcome Collection.
Provider: This material has been provided by King’s College London. The original may be consulted at King’s College London.
50/452 (page 30)
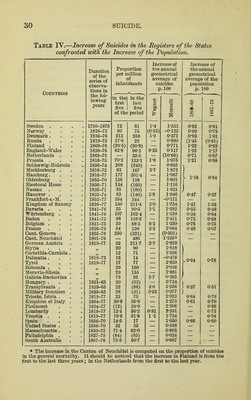
![Table IV.—Increase of Suicides in the Registers of the States confronted with the Increase of the Population. Increase of Increase of Duration of the Proportion the annual the annual per million geometrical geometrical series of observa- of average of suicides average of the population inhabitants COUNTBIES tions in p. 100 p. 100 the fol- lowing in the first 1 in the last S3 i=! % o CO years five five 00 05 W fH 1 of the period O !^ o CO Sweden .... 1750-1875 12 81 1-4 1-531 0-82 0-81 Norway .... 1826-73 80 75 (0-53) -0-122 0-99 0*79 Denmark.... 1836-76 213 258 1-9 0-371 0*93 1-01 Russia .... 1819-75 17-6 29 0-880 (1-45 (0-81) Finland .... 1869-76 (29-5) (30-8) 0-771 1*22 0*62 England-Wales 1830-76 62-8 66-3 0-25 0-117 1*32 1*17 Netherlands . 1869-72 — 35-5 (10*66) 0-71 0-87 Prussia .... 1816-75 70-2 133-1 1-6 1-075 1-21 0*98 Schleswig-Holstein 1856-74 209 (240) 0-695 Mecklenburg . 1816-75 63 167 3-7 1-872 ] Hamburg. 1816-77 177 301-4 1*067 \ 1-16 Oldenburg 1855-70 156 198 1-601 0-84 Electoral Hesse 1856-71 134 (160) 1-116 Nassau .... 1836-71 85 (160) 1-823 j Hanover .... 1825-74 83 (140) 3-6 1-046 0-47 0-27 Frankfort-s.-M. 1852-77 354 344 -0-111 Kingdom of Saxony- 1836-77 150 311-4 3-0 1-754 1-41 1-55 Bavaria . . 1841-76 55 90-5 1*1 1-392 0-55 0-48 Wurtemberg . 1841-76 107 162-4 1-159 0-34 0*64 Baden .... 1841-75 68 156-6 2-411 0-73 0-68 Belgium .... 1831-75 39 68-5 6-3 1-259 0-76 0-75 France .... 1826-75 54 150 3-3 2-064 0-48 0-07 Cant. Geneva . 1825-76 250 (321) 486 (0-501) Cant. Neuch^tel 1801-76 1-238* German Austria 1819-77 32 211-7 2-7 2-829 Styria .... 20 90 2-818 Carinthia-Camiola . 1819-72 12 71 3'296 Dalmatia.... 16 14 -0-478 hO-64 0-78 Tyi'ol .... 1819-77 17 77 2-829 Bohemia .... 29 160 2-936 Moravia-Silesia 29 155 2-881 Galicia-Buckovina . 79 98 3-7 0-365 / Hungary .... 1851-65 30 (52) 3-734 Transylvania . . . 1839-65 22 (88) 4-6 5-266 1 0-27 0-51 Military frontiers . 1839-65 28 (31) 0-52 0-377 Trieste, Istria . 1819-77 23 75 2-023 0-64 0-78 Kingdom of Italy . 1864-77 30-8 36-8 1-279 0-61 0-70 Piedmont 1824-77 (12) 39-0 2-206 0-86 Lombardy 1819-77 12-4 50-2 0-81 2-391 0-73 Venetia .... 1819-77 18-8 51-8 1 -1 1-734 0-94 Spain .... 1856-70 14-5 17 1-050 0-66 0-60 United States . 1856-70 32 35 0-598 Massachusetts. 1859-75 71-4 82-0 0-803 Philadelphia . 1827-75 (84) (85) 0-024 South Australia 1867-76 75-5 80-7 0-667 - i * The increase in the Canton of Neuchatel is computed on the proportion of suicides in the general mortality. It should be noticed that the increase in Finland is from the first to the last three years ; in the Netherlands from the first to the last year.](https://iiif.wellcomecollection.org/image/b21292905_0052.jp2/full/800%2C/0/default.jpg)