Further report and papers on epidemic influenza, 1889-92 / with an introduction by the Medical Officer of the Local Government Board.
- Great Britain. Local Government Board.
- Date:
- 1893
Licence: Public Domain Mark
Credit: Further report and papers on epidemic influenza, 1889-92 / with an introduction by the Medical Officer of the Local Government Board. Source: Wellcome Collection.
Provider: This material has been provided by The University of Glasgow Library. The original may be consulted at The University of Glasgow Library.
39/204 (page 25)
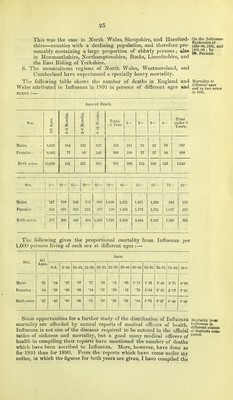
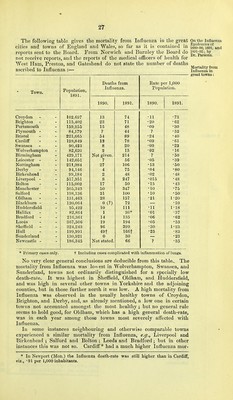
![This was the case in North Wales, Shropshire, and Hereford- E^i^e^fp^^of®™*^ shire—counties with a declining population, and therefore pre- i889-90, i89i, and sumably containing a large proportion of eldei-ly persons; also g^^^^^sons in Monmouthshire, Northamptonshire, Bucks, Lincolnshire, and the East Eiding of Yorkshire. 6. The mountainous regions of North Wales, Westmoreland, and Cumberland have experienced a specially heavy mortality. The following table shows the number of deaths in England and Mortality at Wales attributed to Influenza in 1891 in persons of different ages aad and^n'tw^sexes Ages at Death. Sex. All Ages. 0-3 Monti 3-6 Monti 6-12 Mon1 Total, —1 Year. 1— 2— 3— 4— Total under -5 Years. Males 8,621 164 132 257 553 211 76 52 6.5 957 Females - 8,065 77 89 112 308 188 77 57 58 688 Both sexes • 16,686 241 221 399 861 399 153 109 123 1,645 Sex. 5— 10— 15— 20— 25— E5— 45— 55— 65— 75- 85— Males 127 108 246 668 1,000 1,321 1,471 1,526 832 113 Females 150 10] 203 242 597 729 1,035 1,373 1,721 1,007 219 Both sexes - 277 209 449 494 1,265 1,729 2,356 2,844 3,247 1,839 332 The following gives the proportional mortality from Influenza per 1,000 persons living of each sex at different ages :— Sex. All Ages. Ages. 0-5. 5-10. 10-15. 15-20. 20-25. 25-35. 35-45. 45-55. 55-65. 65-75.j 75-85. 85+ Males •61 54 •07 ■07 •17 •20 •32 •62 VIV 1-91 3^43 5^71 6-93 Females - •54 •38 •09 ■09 •14 •17 •26 •42 •79 1^54 3^12 5'17 7-91 Both .sexes •57 •46 •08 ■08 •15 •19 •29 •52 •94 1-73 3^27 5-40 7^60 Some opportunities for a further study of the distribution of Influenza Mortality from mortality are afforded by annual reports of medical officers of health. difleren™eiasses Influenza is not one of the diseases required to be entered in the oflBcial of districts com tables of sickness and mortality, but a good many medical officers of p'^''''!^ health in compiling their reports have mentioned the number of deaths which have been ascribed to Influenza. More, however, have done so for 1891 than for 1890. Prom the reports which have come under my notice, in which the figures for both years are given, I have compiled the](https://iiif.wellcomecollection.org/image/b21459393_0041.jp2/full/800%2C/0/default.jpg)