[Report 1936] / Medical Officer of Health, Cardiff County Borough & Port.
- Cardiff (Wales). County Borough Council.
- Date:
- 1936
Licence: Attribution 4.0 International (CC BY 4.0)
Credit: [Report 1936] / Medical Officer of Health, Cardiff County Borough & Port. Source: Wellcome Collection.
146/212 (page 126)
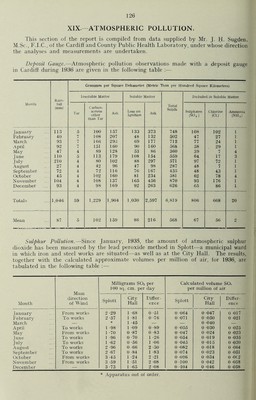
![XIX.—ATMOSPHERIC POLLUTION. This section of the report is compiled from data supplied by Mr. J. H. Sugden, M.Sc., F.I.C., of the Cardiff and County Public Health Laboratory, under whose direction the analyses and measurements are undertaken. Deposit Gauge.—Atmospheric pollution observations made with a deposit gauge in Cardiff during 1936 are given in the following table :— Grammes per Square Dekametre (Metric Tons per Hundred Square Kilometres) Month Rain- fall (mm) Insoluble Matter Soluble Matter Total Solids Included in Soluble Matter Tar Carbon- aceous other than Tar Ash Loss on Ignition Ash Sulphates (SO,) Chlorine (Cl.) Ammonia (NH,) January 113 5 100 157 133 373 748 108 102 1 February 40 7 108 207 48 132 502 47 27 1 March 93 7 106 29.5 69 177 712 77 24 ] April 92 7 151 160 90 160 568 58 29 1 May 47 4 89 128 53 86 360 39 7 4 June 110 5 113 179 108 154 559 64 17 3 July 210 4 80 102 88 297 571 97 72 1 August 27 4 42 96 47 98 287 48 7 1 September 72 4 72 116 76 167 435 48 43 1 October 45 4 102 160 81 234 581 62 78 4 November 104 4 108 137 165 456 870 93 176 1 December 93 4 98 169 92 263 626 65 86 1 Totals 1,046 59 1,229 1,904 1,030 2,597 6,819 806 668 20 Mean 87 5 102 159 86 216 568 67 56 ■ Sulphur Pollution.—Since January, 1935, the amount of atmospheric sulphur dioxide has been measured by the lead peroxide method in Splott—a municipal ward in which iron and steel works are situated—as well as at the City Hall. The results, together with the calculated approximate volumes per million of air, for 1936, are tabulated in the following table :— Month Mam direction of Wind Milligrams SC 100 sq. cm. pe s per r day Calculated volume SO-- per million of air Splott City Hall Differ- ence Splott City Hall Differ- ence January From works 2 -29 1 -68 0 -51 0 -064 0 -047 0 -017 February To works 2 -57 1 -81 0 -76 0 -071 0 050 0 -021 March — * 1 -45 — — 0 -040 — April To works 1 -98 1 -09 0 -89 0 -055 0 030 0 025 Mav From works 1 -70 0 -87 0 -83 0 047 0 -024 0 023 June To works 1 -96 0 -70 1 -26 0 054 0 -019 0 -035 July To works 1 -62 0 -56 1 -06 0 -045 0 -015 0 -030 August To works 2 -96 0 -66 2 -30 0 -082 0-018 0 -064 September To works 2 -67 0 -84 1 -83 0 -074 0 -023 0 -051 October From works 3 -45 1 -24 2 -21 0 096 0 -034 0 -0C2 November From works 3 -59 1 -51 2 -08 0 -100 0 042 0 -058 December 3 -73 1 -65 2 -08 0 104 0 -046 0 -058 Apparatus out of order.](https://iiif.wellcomecollection.org/image/b28834185_0148.jp2/full/800%2C/0/default.jpg)