[Report 1929] / Medical Officer of Health, Cumberland County Council.
- Cumberland County Council
- Date:
- 1929
Licence: Attribution 4.0 International (CC BY 4.0)
Credit: [Report 1929] / Medical Officer of Health, Cumberland County Council. Source: Wellcome Collection.
13/68 page 13
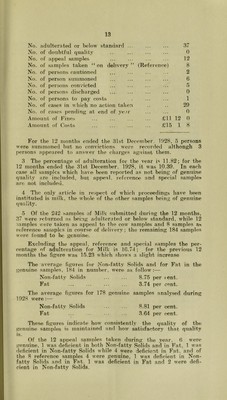
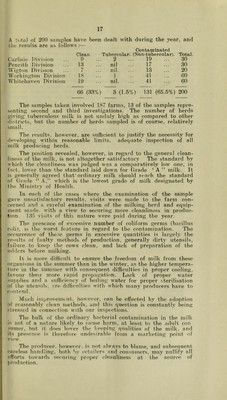
![No. adulterated or below standard ... No. of doubtful quality No. of appeal .samples No. of sam])les taken “ on delivery ” No. of person.s cautioned No. of person summoned No. of persons convicted No. of persons discharged No. of persons to pay costs No. of cases in which no action taken No. of cases pending at end of ye n' Amount of Fines Amount of Costs (Reference) 37 0 12 8 2 6 5 0 1 29 £11 12 £15 1 0 n 8 For the 12 months ended the 31st December. 1928, 5 persons were summoned but no convictions were recorded althongh 3 liersons appeared to answer the charges against them. 3 The percentage of adulteration for the vear is 11.82; for the 12 months ended the 31st December. 1928, it was 10.39. In each case all samples which have been reported as not being of genuine quality are included, but appeal, reference and special samples are not included. 4 'fixe only article in re.spect of which proceedings have been instituted is milk, the whole of the other samples being of genuine quality. 5 Of the 242 samples of Milk submitted during the 12 months, 37 xvei'e x-eturixed as being adulterated or beloxv standard, while 12 samples wei'e takeix as appeal to the cow samples and 8 samples as reference saiiipics in course of deliveiy; the I’emaining 184 samples wei-e found to be genuine. Excluding the appeal, reference and special samples the per- centage of adulteration for Milk is 16.74 ; for the previoxxs 12 months the fxgure was 15.23 which shows a slight increase The average figures for Non-fatty Solids and for Fat in the genuine samples, 184 in nuxnber, were as follow :— Non-fatt3’ Solids ... ... 8.75 per cent. Fat ... ... ... ... 3.74 per cent. The average figxires for 178 genuine samples analysed during 1928 were :— Non-fatty Solids ... ... 8.81 per cent. Fat ... •• ■ • 3.64 per cent. These figures indicate how consistently the quality of the genuine samples is maintained and how satisfactory that quality is. Of the 12 appeal samples taken during the year. 6 were genuine, 1 was deficient in both Non-fatty Solids and in Fat, 1 was deficient in Non-fatty Solids while 4 were deficient in Fat. and of the 8 refex’ence samples 4 were genuine, 1 was deficient in Non- fatty Solids and in Fat. 1 xvas deficient in Fat and 2 were defi- cient in Non-fatty Solids.](https://iiif.wellcomecollection.org/image/b29132903_0015.jp2/full/800%2C/0/default.jpg)