Census 1951, England and Wales : housing report.
- General Register Office Northern Ireland
- Date:
- 1956
Licence: Public Domain Mark
Credit: Census 1951, England and Wales : housing report. Source: Wellcome Collection.
62/290
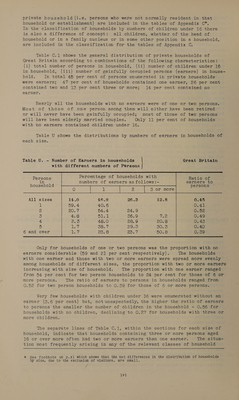
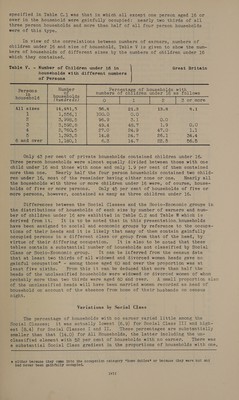
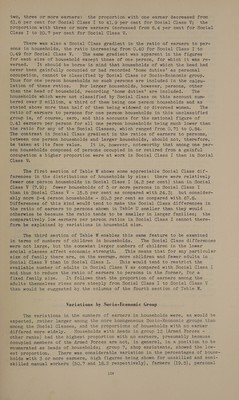
![private household (i.é. persons who were not normally resident in that household or establishment) are included in the tables of Appendix C*. In the classification of households by numbers of children under 16 there is also a difference of concept: all children, whether of the head of household or in a family nucleus or in some other position in a household, are included in the classification for the tables of Appendix C. Table C.1 shows the general distribution of private households of Great Britain according to combinations of the following characteristics: (i) total number of persons in household, (ii) number of children under 16 in household, (iii) number of gainfully occupied persons (earners) in house- hold. In total 45 per cent of persons enumerated in private households were earners; 47 per cent of households contained one earner, 26 per cent contained two and 13 per cent three or more; 14 per cent contained no earner. Nearly all the households with no earners were of one or two persons. Most of those of one person among them will either have been retired or will never have been gainfully occupied; most of those of two persons will have been elderly married couples. Only 11 per cent of households with no earners contained children under 16. Table U shows the distributions by numbers of earners in households of each size. with different numbers of Persons Percentage of households with Persons : Ratio of zip a) numbers of earners as follows:- earners to household persons [0 a a All sizes Qi CrO16 72 QP PAK OP > oOOWonw}Y Only for households of one or two persons was the proportion with no earners considerable (59 and 21] per cent respectively). The households with one earner and those with two or more earners were spread more evenly among households of different sizes, the proportion with two or more earners increasing with size of household. The proportion with one earner ranged from 54 per cent for two person households to 24 per cent for those of 6 or more persons. The ratio of earners to persons in households ranged from 0.52 for two person households to 0.39 for those of 6 or more persons. Very few households with children under 16 were enumerated without an earner (3.6 per cent) but, not unexpectedly, the higher the ratio of earners to persons the smaller the number of children in the household - 0.56 for households with no children, declining to 0.27 for households with three or more children.: The separate lines of Table C.1, within the sections for each size of household, indicate that households containing three or more persons aged 16 or over more often had two or more earners than one earner. The situa- tion most frequently arising in any of the relevant classes of household * See footnote on p.xl which shows that the net differences in the distribution of households by size, due to the exclusion of visitors, are small. /](https://iiif.wellcomecollection.org/image/b32183240_0062.jp2/full/800%2C/0/default.jpg)
 No text description is available for this image
 No text description is available for this image
 No text description is available for this image