Census 1951, England and Wales : housing report.
- General Register Office Northern Ireland
- Date:
- 1956
Licence: Public Domain Mark
Credit: Census 1951, England and Wales : housing report. Source: Wellcome Collection.
70/290
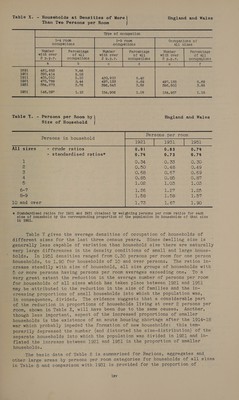
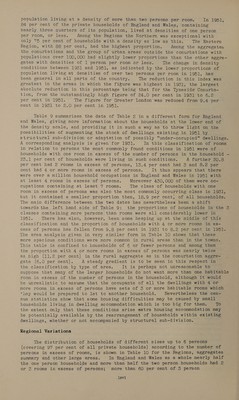
![It is perhaps not out of place to call attention to an important dis- tinction between a direct measure of overcrowding and such indirect measures as can be obtained from census statistics. Even if a perfect relationship existed such that the number of households found to be living at a density of more than x persons per room in an area was the same as the number over- crowded on, say, the statutory overcrowding standard, this would not neces- sarily mean that the overcrowded households were the same households as those living at more than x persons per room. For example, the number of house- holds in an area living at 2 persons per room or higher density has been found to be a measure of the number of households overcrowded on the (c) ver- sion of the Manchester standard. Yet according to this standard a house- hold consisting of a married couple and one child under 10 would not be over- crowded living in one room at three persons per room; but a household of three non-married adults would be overcrowded living in two rooms at 1% persons per room. In other words a simple density standard-may be valid when applied as a statistical average to summarise the general conditions of a large group of households, for example those in a particular area, but it cannot be used to determine whether a particular household is overcrowded. The density statistics which have been produced from the 1951 Census material are of two distinct types. In the first place cross-tabulations of households by numbers of persons and numbers of rooms, and derivatives of this material, have been produced on a pattern similar to those tabulations produced in previous censuses: such tabulations form the basis of compari- sons over time and between local areas. In the second place the sample Household Composition tables of Appendix A provide evidence with which to compare the housing conditions (in terms of persons per room) of different types of household unit (in terms of the relationships, etc., of other mem- bers of the household to its head) in Great Britain as a whole in 1951. These two aspects are discussed in turn in the following sections. A third aspect, the sharing of dwellings by more than one household, is discussed in Chapter VII. Conditions in 195] and Changes in Intercensal Periods Persons in Relation to Rooms by Size of Household The cross-tabulations of households by numbers of persons therein and by numbers of rooms occupied, given in Table 2, provide the basic material for studies of density on a basis which allows comparisons to be made be- tween areas and between one census date and another. Density conditions reflect, in large part, the sizes of the dwellings available to households of different kinds and sizes but it must again be emphasised that they will not necessarily reflect the needs or desires: of the population. The statis- ties provide an objective picture of conditions existing in 1951. Table 2 specifies households of every size up to 12 persons and occupations of every size, in terms of numbers of rooms, up to 14, for England and Wales, for the Standard Regions, and for the aggregates summary. With considerably less detail by size of household similar information is also given for the conur- bations, for London A.C. and for the five County Boroughs with more than 500, 000 population. Similar tables for all individual local authority areas are contained in the 1951 Census series of County Reports, and indices from them are contained in Table 13 of this report. Table X provides a summary comparison with previous censuses of the proportions of households living at densities of over 2 persons per room, in so far as the earlier records are available. Households living inl - 4 room occupations at a density of more than 2 persons per room represented 7,86 per cent of all households in 189] but only 1.12 per cent in 1951. The proportion of all private households living at such densities has fallen from 5.69 per cent in 1921 to 1.18 per cent in 1951. 1xiv](https://iiif.wellcomecollection.org/image/b32183240_0070.jp2/full/800%2C/0/default.jpg)
 No text description is available for this image
 No text description is available for this image
 No text description is available for this image