Census 1951, England and Wales : housing report.
- General Register Office Northern Ireland
- Date:
- 1956
Licence: Public Domain Mark
Credit: Census 1951, England and Wales : housing report. Source: Wellcome Collection.
74/290
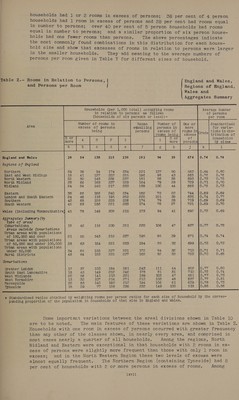
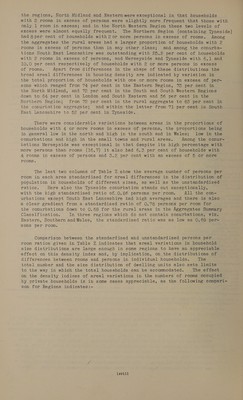
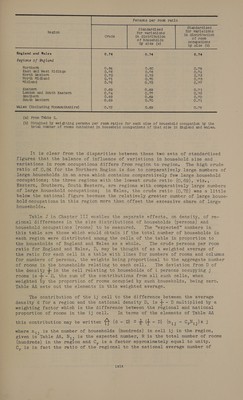
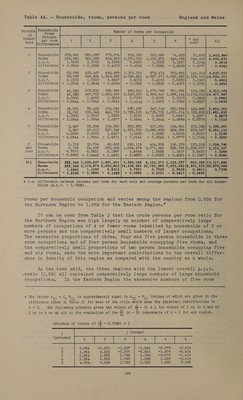
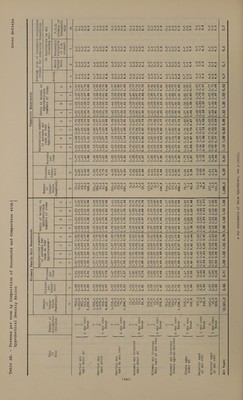
![with 2 rooms in excess of persons were slightly more frequent that those with only 1 room in excess; and in the North Western Region these two levels of excess were almost equally frequent. The Northern Region (containing Tyneside) had 8per cent of households with2or more persons in excess of rooms. Among the aggregates the rural areas had a larger proportion of households with 2 rooms in excess of persons than in any other class; and among the conurba- tions South East Lancashire was outstanding with 25.2 per cent of households with 2 rooms in excess of persons, and Merseyside and Tyneside with 6.1 and 10.0 per cent respectively of households with 2 or more persons in excess of rooms. Apart from differences in the shape of these distributions the broad areal differences in housing density are indicated by variation in the total proportion of households with one or more rooms in excess of per- sons which ranged from 74 per cent in the Eastern Region, 73 per cent in the North Midland, and 72 per cent in the South and South Western Regions down to 64 per cent in London and South Eastern and 56 per cent in the Northern Region; from 72 per cent in the rural aggregate to 63 per cent in the conurbation aggregate; and within’the latter from 7] per cent in South Kast. Lancashire to 52 per cent, in Jyneside.. There were considerable variations between areas in the proportions’ of households with 4 or more rooms in excess of persons, the proportions being in general low in the north and high in the south and in Wales; low in the conurbations and high in the small towns and rural areas. Among the conur- bations Merseyside was exceptional in that despite its high percentage with more persons than rooms (16.7) it also had 6.3 per cent of households with 4 rooms in excess of persons and 3.2 per cent with an excess of 5 or more rooms. The last two columns of Table Z show the average number of persons per room in each area standardised for areal differences in the distribution of population in households of different sizes, as well as the unstandardised ratios. Here also the Tyneside conurbation stands out exceptionally, with the high standardised ratio of. 0.86 persons per room. All the con- urbations except South East Lancashire had high averages and there is also a clear gradient from a standardised ratio of 0.78 persons per room for the conurbations down to 0.68 for the rural areas in the Aggregates Summary Classification. In three regions which do not contain conurbations, viz. Eastern, Southern andWales, the standardised ratio was as low as 0.69 per- sons per room. Comparison between the standardised and unstandardised persons per room ratios given in Table Z indicates that areal variations in household size distributions are large enough in some regions to have an appreciable effect on this density index and, by implication, on. the distributions of differences between rooms and persons in individual households. The total number and the size distribution of dwelling units also sets limits to the way in which the total households can be accommodated. The effect on the density indices of areal variations in the numbers of rooms occupied by private households is in some cases appreciable, as the following compari- son for Regions indicates:- lxviil](https://iiif.wellcomecollection.org/image/b32183240_0074.jp2/full/800%2C/0/default.jpg)
 No text description is available for this image
 No text description is available for this image
 No text description is available for this image