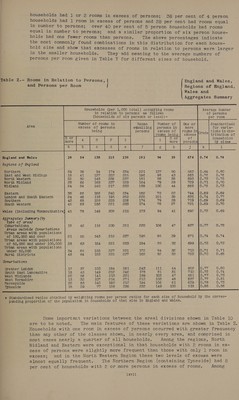
Census 1951, England and Wales : housing report.
- General Register Office Northern Ireland
- Date:
- 1956
Licence: Public Domain Mark
Credit: Census 1951, England and Wales : housing report. Source: Wellcome Collection.
76/290
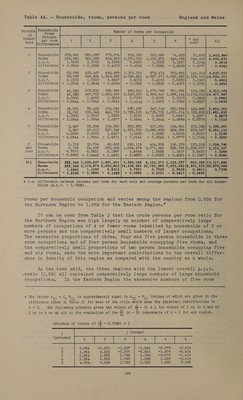
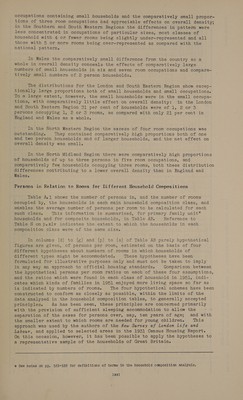
![Table AA. ~ Households, rooms, persons per room England and Wales Households Persons Rooms Number of Rooms per Occupation res Persons d cane per room 1 2 3 4 5 fea k All Differencex 1 Households} 203,891 281,283 273,274 318, 190 220, 595 74,433 31,683] -1,403, 349 Rooms 203, 891 562, 566 819, BSc tieves 7600 11,202,975 446, 598 246,808] 4,655,420 De Del's 1.0000 0. 5000 02 6455 0.2500 0.2000 0.1667 0.1284 0.3014 difference 0.2644 - 0.2356 - 0.4023| - 0.4856 - 0.5356 —- 0.5689] -— 0.6072 - 0.4342 2 Households 85, 288 423, 467 649, 850] 1,023,231 979,474 323,822 141,919] 3,627,051 Rooms 85, 288 846,934 1,949,550] 4,092,924 4,897,370 1,942, 932]1, 105, 103/14, 920, 101 Dabet 2.0000 1.0000 0.6667 0.5000 0.4000 O6sa55 0.2568 0. 4862 difference 1.2644 + 0.2644 - 0.0689 = OscO56 ='0.3356 “— 0.4025 = 1074788 - 0.2494 3 Households 42,093 223,655 526, 896 960,650 1,072,'768 3515 024 155,098] 3,312,184 Rooms 42, 093 447,310 1,580,688| 3,842,600 5,363,840 1, 986,144]1, 215, 212114, 477, 887 D.D.r. 3.0000 1.5000 1.0000 0.7500 0.6000 0.5000 0.3829 0.6863 difference 2.2644 + 0.7644 + 0.2644 + 0.0144 - 0.1356 — 0.23556! = 0.3527 - 0.0493 4 Households 15,281 92,522 315,246 697,130 947,747 280,269 142, 998| 2,491,193 Rooms 15,281 185,044 945,738] 2,788,520 4,738,735 1,681, 614]1, 126, 688]11, 481,620 Do Delve 4.0000 2. 0000 eOOOS 1.0000 0.8000 0.6667 0.5077 0. 8679 difference 3.2644 1.2644 +. 0.5977) + 0.2644 + 0.0644 —.0.06891)—s2e79 - 0.1323 5 Households 3, 937 26, 206 119, 082 332, 825 sails koteltl 159, 881 100, 039} 1,259,351 Rooms 3, 937 52,412 357,246| 1,331,300 2,586,905 959, 286 800,047| 6,091,133 p.D.r. 5.0000 2.5000 1.6667 1.2500 1.0000 0.8333 0.6252 1.0338 difference 4.2644 1.7644. + 0.9511 | + 0.5144 + 0.2644 +.0.9777) — Osi104 |= eeomcons 6 Households 2,109 12,704 66, 853 252,119 414, 308 L56,120 120,519] 1,024,740 and Rooms 2,109 25,408 200,559] 1,008,476 2,071,540 936,768 |1,008,067]| 5,252,927 over |)p.Dp.Tr. Celceu 3.2801 2.1987 1.6856 1.3559 P1627 0.8423 1.3296 difference} + 6.9865 + 2.5445 + 1.4631] + 0.9500 + 0.6203 + 0.4261] + 0.1067} + 0.5940 All | Households 352,599 1,059,837 1,951,201 | 3,584,145 4,152,273 1,325,557] 692,256 |13,117,868 Rooms 352,599 2,119,674 5,853,603 |14, 336,580 20,761,365 7,953,342 |5,501, 925 |56, 879,088 PePeLe 1.6895 1.1245 0.9312 0.7951 0.7025 0.5939 0.4911 0.7356 difference | + 0.9539 + 0.3889 + 0.1956] + 0.0595 - 0.0331 - 0.1417] - 0.2445 “ * i.e. difference between persons per room for each cell and average persons per room for all house- holds {p.p.r. — 0.7356). rooms per household occupation and varies among the regions from 0.924 for the Northern Region to 1.069 for the Eastern Region. * It can be seen from Table J that the crude persons per room ratio for the Northern Region was high largely on accotint of comparatively large numbers of occupations of 4 or fewer rooms inhabited by households of:-3 or more persons and the comparatively small numbers of larger occupations. The excessive proportions of three, four and five person households in three room occupations and of four person households occupying five rooms, and the comparatively small proportions of two person households occupying five and six rooms, made the more important contributions to the overall differ- ence in density of this region as compared with the country as a whole, As has been said, the three regions with the lowest overall pepe. ‘ratio (0.69) all contained comparatively large numbers of large household occupations. In the Eastern Region the excessive numbers of five room * The factor Nyy - Ch Nyy is approximately equal to Nyy - Nyy (values of which are given in the difference lines in Table J) for most of the cells which make the important contributions to gd - D. The following schedule gives the values of q - D) x j for values of 1 up to 5 and of j up to 6 as an aid to the evaluation of the a (d - D) components of d - D for any region. : i (persons) -0.471 al 2 1.264 0.529 -0.207 -0.942 -1.678 “2.414 3 £4264 1.529 0.793 0.058 -0.678 —1.414 4 3.264 2.529 1.793 1.058 0.322 -0.414 5 3.529 2.793 2.058 1.322 0.586](https://iiif.wellcomecollection.org/image/b32183240_0076.jp2/full/800%2C/0/default.jpg)
 No text description is available for this image
 No text description is available for this image
 No text description is available for this image