[Report 1938] / Medical Officer of Health, Birkenhead County Borough.
- Birkenhead (England). County Borough Council.
- Date:
- 1938
Licence: Attribution 4.0 International (CC BY 4.0)
Credit: [Report 1938] / Medical Officer of Health, Birkenhead County Borough. Source: Wellcome Collection.
17/122 page 1
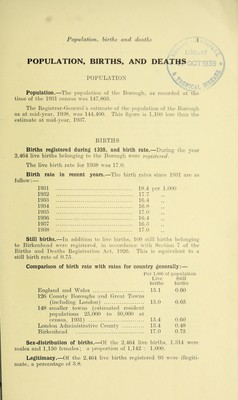
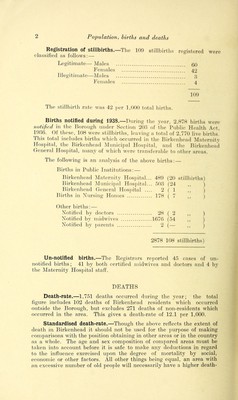
![POPULATION, BIRTHS, AND DEATHS POPULATION Population.—The population of the Borough, as recorded at the time of the 1981 census was 147,803. The Eegistrar-General’s estimate of the jiopulation of the BoroUi:h as at mid-year, 1938, was 144,400. This figure is 1,100 les^ than the estimate at mid-year, 1937. BIRTHS Births registered during 1938, and birth rate.—During tlie year 2,464 live births belonging to the Borough were registered. The live birth rate for 1938 was 17.0. Birth rate follow: — in recent years.—The birth rates since 1931 1931 . 18 4 per 1,000 1932 17 7 1933 . 16 4 ” 1934 . 16 8 > } 1935 . 17.0 y y 1936 . 16 4 ” 1937 . 10.3 y y 1938 . 17.0 Still births.—In addition to live birtlis, 109 still births belonging to Birkenhead were registei-ed, in accordance with Section 7 of the Births and ]4eaths Registi-aiion Act, 1926. This is equivalent to a still birth rate of 0.75. Comparison of birth rate with rates for country generally: — Per 1,000 of population Live Still births births England and Wales 15.1 0.60 126 County Boroughs and Great Towns (including London) 15.0 0.65 148 smaller towns (estimated resident populations 25,000 to 50,000 at census, 1931) 15.4 0.60 London Administrative Countv 13.4 0.48 Birkenhead 17.0 0.75 Sex-distribution of births.—Of the 2,464 live births, 1,314 were males and 1,150 females; a proportion of 1,142 : 1,000. Legitimacy.—Of the 2,464 live births registered 93 were illegiti- mate, a percentage of 3.8,](https://iiif.wellcomecollection.org/image/b28927321_0019.jp2/full/800%2C/0/default.jpg)