Report of the Director-General of Public Health, New South Wales.
- New South Wales. Department of Public Health
- Date:
- [1933]
Licence: Public Domain Mark
Credit: Report of the Director-General of Public Health, New South Wales. Source: Wellcome Collection.
79/152 page 59
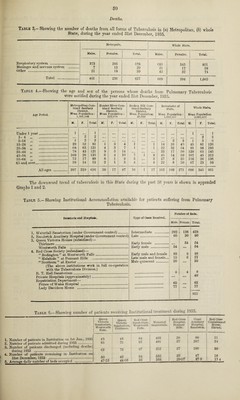
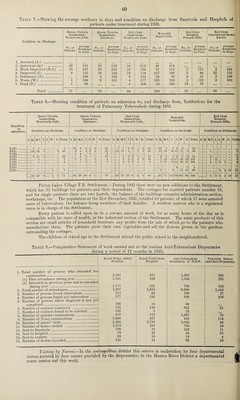
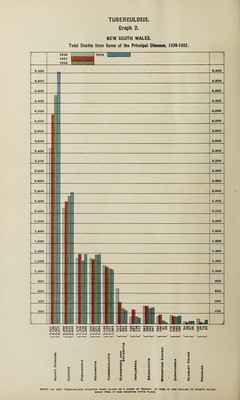
![Deaths. Table 3.—Showing the number of deaths from all forms of Tuberculosis in (a) Metropolitan, (b) whole State, during the year ended 31st December, 1933. Metropolis. Whole State. Males. Females. Total. Males. Females. Total. Respiratory system . 373 205 578 cos 345 951 Meninges and nervous system . 7 13 20 21 17 38 Other . 21 18 39 42 32 74 Total . 401 236 637 669 394 1,063 .Fable 4. Showing the age and sex of the persons whose deaths from Pulmonary Tuberculosis vrere notified during the year ended 31st. December, 1933. Age Period. Metropolitan Com¬ bined Sanitary District. Mean Population: 1,304,580 Hunter River Com¬ bined Sanitary District. Mean Population : 210,970 Broken Hill Com¬ bined Sanitary District. Mean Population! 26,930 Remainder of State. Mean Population : 1,059,557 Whole State. Mean Population. 2,602,037 M. F. Total. M. F. Total. M. F. Total. M. F. | Total. M. F. Total. Under 1 year. 1 1 1 ... 1 1 4 ..... ... 2 2 ... ... ... ... ... .. . . • . ... ... ... 2 2 5 14 „ . 1 2 3 ... ... ... ... • • • ... ... 3 3 1 5 6 15 24 . 29 52 81 1 3 4 1 ... 1 14 26 40 45 81 126 25-34 ,, .. 68 63 131 4 3 7 1 ... 1 22 32 54 95 98 193 35-44 .. 78 43 121 9 5 14 ... ... ... 33 17 50 120 65 185 45 54 „ . 109 26 135 6 4 10 7 1 8 45 14 59 167 45 212 55-64 ,, . 72 17 89 8 1 9 3 ... 3 27 8 35 110 26 136 65 and over. 39 14 53 2 1 3 4 ... 4 22 8 SO 67 23 SO All ages . 397 219 616 30 17 47 16 1 17 163 108 271 606 345 951 The downward trend of tuberculosis in this State during the past 58 years is shown in appended Graphs 1 and 2. Table 5.- Showing Institutional Accommodation available for patients suffering from Pulmonary Tuberculosis. Sanatoria and Hospitals. Type of Case* Received. Number of Beds. Male. Female. Total. l wt*Sanafnrinm frmHftr rJnvftmmftnt nontroH. Intermediate . 292 136 428 2. Randwick Auxiliary Hospital (under Government control) 3. Queen Victoria Homes (subsidised)— Late . 60 30 90 Early femalo . 54 54 Early male . 54 54 4. Red Cross Society (subsidised)—• “ T^rtHinrrfnn ” Wftntworth Trails . Early male and female Late male and female... 89 9 98 15 6 21 Male quiescent . 20 ... 20 (The above institutions work in full co-operation with the Tuberculosis Division.) 4 4 8 ... ... 40 Repatriation Department— 65 • * • 65 77 ... 77 955 Table 6.—Showing number of patients receiving Institutional treatment during 1933. ]. Number of patients in Institution on 1st Jan., 1933 2. Number of patients admitted during 1933 . 3. Number of patients discharged (including deaths) during 1933 .......■••••;. 4. Number of patients remaining in Institution on 31st December, 1933 ...<. 5. Average daily number of beds occupied .. Queen Victoria Sanatorium, Wentworth Falls. Queen Victoria Sanatorium, Thirlmero. Red Cross Sanatorium, Wentworth Falls. Waterfall Sanatorium. Red Cross Hospital, Pennant Hills. Coast Auxiliary Hospital, Randwlck. Red Cross Convalescent Home, Exeter. 43 48 64 403 20 90 11 65 75 97 481 37 287 34 63 79 67 632 37 290 30 60 49 04 362 20 87 10 47'25 484)6 63 368 20*07 870 174](https://iiif.wellcomecollection.org/image/b31485248_0079.jp2/full/800%2C/0/default.jpg)