Investigations concerning bovine tuberculosis : with special reference to diagnosis and prevention / conducted under the direction of D.E. Salmon.
- Date:
- 1894
Licence: Public Domain Mark
Credit: Investigations concerning bovine tuberculosis : with special reference to diagnosis and prevention / conducted under the direction of D.E. Salmon. Source: Wellcome Collection.
182/196 page 168
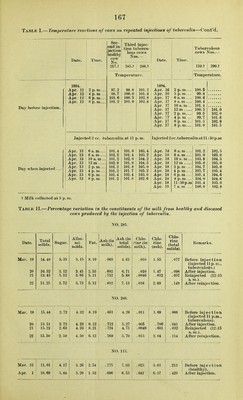
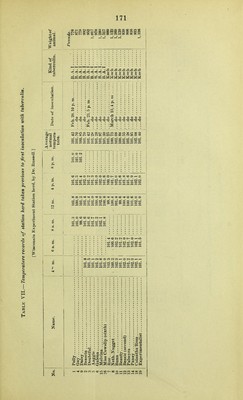
![Table II.—Percen tage variation in the constituents of the milk from healthy and diseased cows produced hi/ the injection of tuherculin—Continued. NO. 217. Date. Total solids. Susiar. Albu mi- ll old. Fat. Chlo- rine (in milk). Chlo- rine (ash). Chlo- rine (total solids). E em arks. Mar. Apr. 31 1 10.83 10. 38 4.17 4.16 2.96 2.89 2.23 2.54 i .723 ; 6.67 .700 ■ C.81 .0023 .072 .325 3. 75 . 0216 .255 Before inj oction (healthy). ■A-ltcr injGCtjioii. NO. 286. Apr. 12 16. 24 1.92 1.56 2. 44 2. 72 in .822 1 5.30 .720 i 5.70 Before injection (tuberculous). Alter injection. 13 12.62 {') .043 6.01 .343 Qnaiitity of milk insufficient for a determination. NO. 110. Apr. 17 18 19 12.59 12. 58 10. 52 3. 84 3.84 3. 84 3. 23 3.20 3.19 5. 14 4.12 3. 08 .672 ' 5.33 .750 ' 5.96 . 666 ; 6. 53 J . 050 .061 .056 7. 54 8.17 8.10 .402 .487 .530 Before inje c ti o n (tuberculous). After injection. Second day after injection. NO. 290. Apr. 17 18 19 13.62 15. 31 11. 23 3.84 3. 57 3. 57 3.48 3.25 3. 43 5. 65 7.23 3.08 .684 ' 5.04 .786 5.13 .667 j 5.66 .0.52 .089 .051 7.70 11.43 7.71 .388 .587 .437 Before inj e c t i o u (tuberculous). After injection. Second day after injection. NO. 217. Apr. 12 13 11. 03 9. 77 4. 17 3.57 1.26 1.39 2. 56 1.53 .681 : 6.17 .727 1 7.44 .054 .060 8.05 8.35 .497 .621 Before injec ti o n (healthy). After injection. 'r.\Bi,K TIT.—Percentage variation in the constituents of the milk front, healthy and diseased coivs produced hy the injection of tuherculin. NO. 286. Date. Specific gravity. Total solids. Ash (milk). Ash (total solids). Albu minoids. Sugar. Fat. - Kemarks. May 15.. 16.- 17.. 1.031 1.029 1.029 10.52 11.13 10. 83 .711 .715 .728 6. 75 6.39 6. 93 2.89 2. 81 2. 71 3. 84 3.84 4.16 3. 05 3.57 2.55 Before injection of tuber- culin. Do. After injection of tuber- culin. NO. 285. May 16.. 17-. ]. 023 1.027 17.01 14. 27 .761 .718 4.47 5.23 4.35 -1.01 2.77 3. 12 10. 27 6. 03 Before injection of tuber- culin. After injection of tuber- culin . Increase after injection in sugar, asli. and sxtecilic gravitj'. Decrease after injection in fat, albuminoids, and total solids.](https://iiif.wellcomecollection.org/image/b21783111_0182.jp2/full/800%2C/0/default.jpg)