[Report of the Medical Officer of Health for Kensington Borough].
- Kensington (London, England). Royal Borough.
- Date:
- [1913]
Licence: Attribution-NonCommercial 4.0 International (CC BY-NC 4.0)
Credit: [Report of the Medical Officer of Health for Kensington Borough]. Source: Wellcome Collection.
12/100 page 4
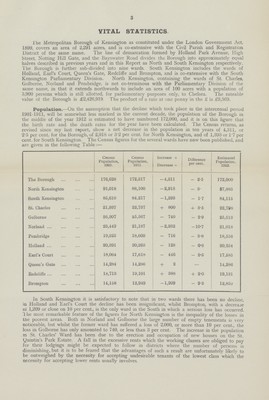
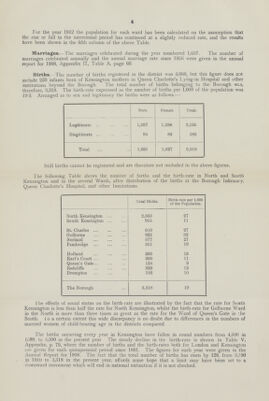
![4 For the year 1912 the population for each ward has been calculated on the assumption that the rise or fall in the intercensal period has continued at a slightly reduced rate, and the results have been shown in the fifth column of the above Table. Marriages.—The marriages celebrated during the year numbered 1,637. The number of marriages celebrated annually and the annual marriage rate since 1856 were given in the annual report for 1908, Appendix II., Table A, page 60. Births.-The number of births registered in the district was 3,068, but this figure does not include 250 infants born of Kensington mothers in Queen Charlotte's Lying-in Hospital and other institutions beyond the Borough The total number of births belonging to the Borough was, therefore, 3,318. The birth-rate expressed as the number of births per 1,000 of the population was 19.3. Arranged as to sex and legitimacy the births were as follows:— ###] Male. Female. Total. Legitimate 1,597 1,538 3,135 Illegitimate 94 89 183 Total 1,691 1,627 3,318 Still births cannot be registered and are therefore not included in the above figures. The following Table shows the number of births and the birth-rate in North and South Kensington and in the several Wards, after distribution of the births at the Borough Infirmary, Queen Charlotte's Hospital, and other Institutions. North Kensington Total Births. Birth-rate per 1,000 of the Population. 2,363 27 South Kensington 955 11 St. Charles 610 27 Golborne 825 32 Norland 577 27 Pembridge 351 19 Holland 266 13 Earl's Court 200 11 Queen's Gate 128 9 Redcliffe 229 12 Brompton 132 10 The Borough 3,318 19 The effects of social status on the birth-rate are illustrated by the fact that the rate for South Kensington is less than half the rate for North Kensington, whilst the birth-rate for Golborne Ward in the North is more than three times as great as the rate for the Ward of Queen's Gate in the South. To a certain extent this wide discrepancy is no doubt due to differences in the numbers of married women of child-bearing age in the districts compared. The births occurring every year in Kensington have fallen in round numbers from 4,500 in 1380, to 3,300 in the present year The steady decline in the birth-rate is shown in Table V. Appendix, p. 79, where the number of births and the birth-rates both for London and Kensington are given for each quinquennial period since 1881. The figures for each year were given in the Annual Report for 1908. The fact that the total number of births has risen by 128, from 3,190 in 1910 to 3,318 in the present year, affords some hope that a limit may have been set to a downward movement which will end in national extinction if it is not checked.](https://iiif.wellcomecollection.org/image/B18235682_0012.jp2/full/800%2C/0/default.jpg)