Report on the public health administration of the Punjab.
- Punjab (India). Public Health Department.
- Date:
- [1931]
Licence: Public Domain Mark
Credit: Report on the public health administration of the Punjab. Source: Wellcome Collection.
84/132 page 68
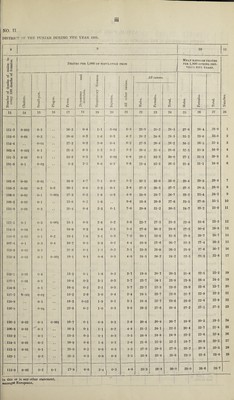
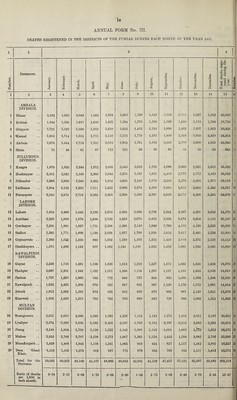
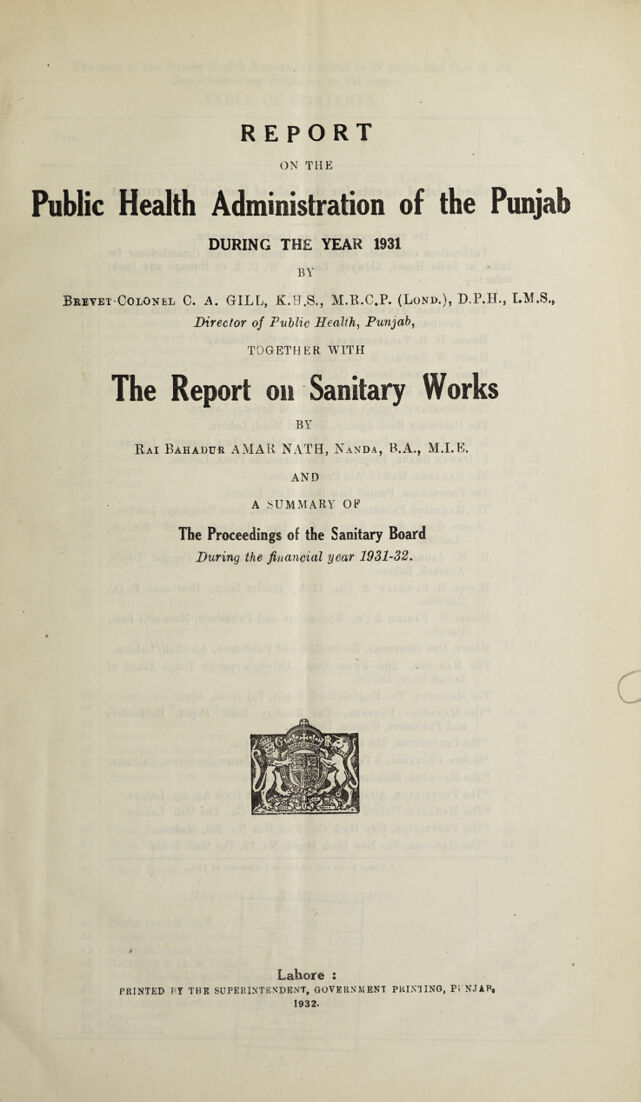
![IV ANNUAL FORM No. III. DEATHS REGISTERED IN THE DISTRICTS OF THE PUNJAB DURING EACH MONTH OF THE YEAR 1931. Number. Districts. January. February. 1 March. April. May. June. July. August. September. October. November. December. Total deaths regis¬ tered during the year. 1 2 3 4 5 6 7 8 9 10 11 12 13 14 15 AMBALA DIVISION. 1 Hissar 2,153 1,825 2,043 1,582 1,619 1,810 1,730 1,545 2,050 2,014 1,827 1,842 22,040 2 Rohtak 1,544 1,501 1,617 1,650 1,822 1,584 1,376 1,258 1,536 1,850 2,174 1,798 19,710 3 Gurgaon 1,721 1,537 1,500 1,373 1,610 1,623 1,453 1,334 1,898 2,463 2,397 1,923 20,832 4 Karoal 1,955 1,714 1,955 1,772 2,119 2 223 1,779 1,302 1,809 2,518 2,858 2,410 24,414 5 Ambala 1,678 1,444 1,719 1,702 2,013 1,982 1,761 1,193 1,502 2,296 2,600 1,955 21,945 6 Simla 75 48 61 67 112 125 86 89 91 89 55 43 941 JULLUNDUR DIVISION. / 7 Kangra 1,979 1,935 2,340 1,972 2,803 2,545 2,022 1,702 2,086 2,605 2,331 2,012 26,332 8 Hoshiarpur .. 2,551 2,031 2,189 2,369 2,644 2,375 2,191 1,821 2,456 2,777 2,772 2,443 28,619 9 Jullundur 1,866 1,600 1,540 1,483 1,814 1,895 2,140 1,973 2,256 2,270 2,304 1,975 23,116 10 Ludhiana 1,504 1,132 1,233 1,211 1,455 2,008 1,874 1,290 1,448 1,852 2,002 1,542 18,551 LAHORE DIVISION. 12 Lahore 2,854 2,466 2,449 2,199 2,616 2,656 2,566 2,706 2,344 3,467 4,391 3,656 34,370 13 Amritsar 2,325 1,900 1,978 1,906 2,792 2,830 2,675 2,482 2,958 3,474 3,654 3,133 32,107 14 Gurdaspur 2,201 1,881 1,827 1,751 2,296 2,266 2,140 1,940 2,769 4,163 4,139 2,935 30,308 15 Sialkot 2,385 1,771 1,606 1,530 2,028 1,637 1,708 1,939 2,652 3,417 2,891 2,336 25,900 16 Gujranwala .. 2,388 1,523 1,358 880 1,302 1,239 1,103 1,353 1,418 2,048 2,374 2,526 19,512 17 Sheikhupura .. 1,575 1,206 1,143 857 1,262 1,245 1,140 1,323 1,452 1,691 1,924 2,062 16,880 RAWALPINDI DIVISION. 18 Gujrat 2,356 1,716 1,361 1,106 1,329 1,313 1,220 1,327 1,571 1,661 1,858 1,858 18,676 19 Shahpur 2,667 2,301 1,848 1,532 1,511 1,486 1,164 1,297 1,197 1,168 1,443 2,005 19,619 20 Jhelum 1,707 1,297 1,000 785 772 840 737 834 850 1,069 1,164 1,304 12,359 21 Rawalpindi .. 1,953 1,435 1,306 979 922 927 951 997 1,120 1,170 1,373 1,681 14,814 22 Attook 1,913 1,503 1,282 973 823 852 838 873 902 967 1,129 1,621 13,676 23 Mianwali 1,503 1,428 1,215 733 782 760 669 692 738 888 1,062 1,222 11,692 MULTAN DIVISION. 24 Montgomery .. 2,55] 2,055 2,098 1,349 1,585 1,336 1,124 1,142 1,273 1,504 2,051 2,587 20,655 25 Lyallpur 2,574 2,298 1,936 1,583 2,434 2,197 1,750 2,195 2,197 2,113 2,340 2,295 25,912 26 Jhang 2,149 1,854 1,750 1,220 1,222 1,143 1,005 1,183 1,019 1,062 1,213 1,652 16,472 27 Multan 2,935 2,760 2,707 2,238 2,373 1,887 1,565 1,528 1,612 1,594 2,082 2,705 25,986 28 Muzaffargarh .. 1,829 1,808 1,943 1,159 1,241 1,065 910 824 827 1,117 1,512 2,092 16,327 29 Dera Ghazi Khan. 1,510 1,505 1,378 913 927 775 676 655 790 843 1,121 1,482 12,575 Total for the Province. 59,561 50,353 49,100 41,157 48,896 46,933 42,941 41,128 47,437 57,824 63,397 60,489 609,216 Ratio of deaths per 1,000 in each month. 2-54 2-15 2-09 1-75 2-08 2-00 1-83 1-75 2-02 2-46 2-70 2-58 25-97 1< ^ I Number.](https://iiif.wellcomecollection.org/image/b31477987_0084.jp2/full/800%2C/0/default.jpg)