Report of the Director-General of Public Health, New South Wales.
- New South Wales. Department of Public Health
- Date:
- [1961]
Licence: Public Domain Mark
Credit: Report of the Director-General of Public Health, New South Wales. Source: Wellcome Collection.
84/170 page 82
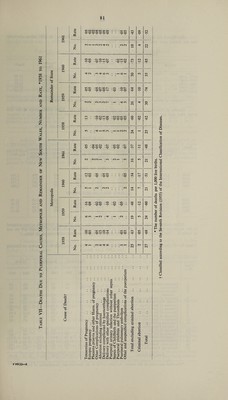
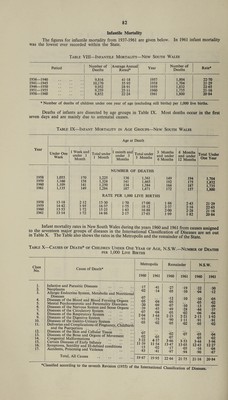
![Infantile Mortality The figures for infantile mortality from 1937-1961 are given below. In 1961 infant mortality was the lowest ever recorded within the State. Table VIII—Infantile Mortality—New South Wales Period Number of Deaths Average Annual Rated* Year Number of Deaths Rate* 1936—1940 9,816 41-18 1957 1,804 22-70 1941—1945 . 10,170 35-95 1958 1,704 21-29 1946—1950 . 9,952 28-91 1959 1,832 22-65 1951—1955 . 9,259 25-11 1960 1,735 21-16 1956—1960 8,852 22-24 1961 1,800 20-84 * Number of deaths of children under one year of age (excluding still births) per 1,000 live births. Deaths of infants are dissected by age groups in Table IX. Most deaths occur in the first seven days and are mainly due to antenatal causes. Table IX—Infant Mortality in Age Groups—New South Wales Age at Death Year Under One Week 1 Week and under 1 Month Total under 1 Month 1 month and under 3 Months Total under 3 Months 3 Months and under 6 Months 6 Months and under 12 Months Total Under One Year NUMBER OF DEATHS 1958 1,055 170 1,225 136 1,361 149 194 1,704 1959 1,166 158 1,324 141 1,465 192 175 l'832 1960 1,109 141 1,250 134 1,384 164 187 1*735 1961 1,135 149 1,284 187 1,471 172 157 L800 RATE PER 1,000 LIVE BIRTHS 1958 13-18 2-12 15-30 1-70 17-00 1-86 2-43 21-29 1959 14-42 1-95 16-37 1-75 18-12 2-37 2-16 22-65 1960 13-53 1-72 15-25 1-63 16-88 2-00 2-28 21-16 1961 13-14 1-72 14-86 2-17 17-03 1-99 1-82 20-84 Infant mortality rates in New South Wales during the years 1960 and 1961 from causes assigned to the seventeen major groups of diseases in the International Classification of Diseases are set out in Table X. The Table also shows the rates in the Metropolis and the remainder of the State. Table X—Causes of Death* of Children Under One Year of Age, N.S.W.- per 1,000 Live Births -Number of Deaths Class No. 1. 2. 3. 4. 5. 6. 7. 8. 9. 10. 11. 12. 13. 14. 15. 16. 17. Cause of Death* Infective and Parasitic Diseases Neoplasms Allergic Endocrine System, Metabolic and Nutritional Diseases Diseases of the Blood and Blood Forming Organs Mental Psychoneurotic and Personality Disorders Diseases of the Nervous System and Sense Organs Diseases of the Circulatory System Diseases of the Respiratory System .. ]. Diseases of the Digestive System .. j ’ Diseases of the Genito-Urinary System .! Deliveries and Complications of Pregnancy, Childbirth and the Puerperium Diseases of the Skin and Cellular Tissue ’.! Diseases of the Bone and Organs of Movement Congenital Malformations . Certain Diseases cf Early Infancy .! ’ ’ Symptoms, Sentility and Ill-defined conditions Accidents, Poisoning and Violence Total, All Causes Metropolis Remainder N.S.W. 1960 1961 1960 1961 1960 1961 •17 •41 •27 •19 •22 •30 •02 •14 •05 •10 •04 •12 •07 .. •12 •10 •10 •05 •05 •04 ■05 •05 •02 •20 •09 •07 •10 ■13 •09 •39 •45 •49 •28 •44 •37 •07 •04 •05 •02 •06 •04 2-04 1-64 2-23 2-21 213 1-92 •93 •73 •90 Ml •91 •91 •05 •02 •05 •02 •05 •02 07 # # 02 07 05 04 •02 •05 •07 •05 •02 3-22 4-37 3-66 3-53 3-44 3-96 11-39 11-54 13-47 13-03 12-43 12-27 •15 •02 •17 •05 •16 •04 •83 •41 •97 •94 •90 •67 19-67 19-95 22-64 21-75 2116 20-84 •Classified according to the seventh Revision (1955) ofifiTl^e^aT^las^ation of Diseases.](https://iiif.wellcomecollection.org/image/b31485522_0084.jp2/full/800%2C/0/default.jpg)