Report of the Director-General of Public Health, New South Wales.
- New South Wales. Department of Public Health
- Date:
- [1961]
Licence: Public Domain Mark
Credit: Report of the Director-General of Public Health, New South Wales. Source: Wellcome Collection.
94/170 page 92
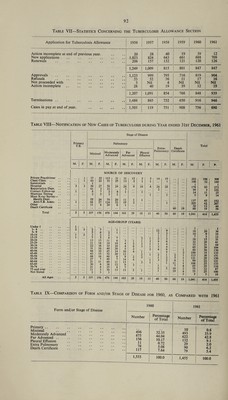
![Table VII—Statistics Concerning the Tuberculosis Allowance Section Application for Tuberculosis Allowance 1956 1957 1958 1959 1960 1961 Action incomplete at end of previous year. 20 28 40 19 39 12 New applications 1,023 824 643 661 688 709 Renewals .. . 206 .57 132 121 120 126 1,249 1,009 815 801 847 847 Approvals . 1,123 999 795 716 819 904 Refusals . 53 52 36 11 17 16 Not proceeded with . 3 Nil 4 Nil Nil Nil Action incomplete. 28 40 19 39 12 19 1,207 1,091 854 766 848 939 Terminations .. 1,486 865 752 650 916 946 Cases in pay at end of year. 1,503 119 751 908 756 690 Table VIII—Notification of New Cases of Tuberculosis during Year ended 31st December, 1961 Stage of Disease Primary T.B. Pulmonary Minimal Moderately Advanced Far Advanced Pleural Effusion M. | F. M. | F. M. F. M. J F. M. F. Extra- Pulmonary Death Certificate M. F. M. F. SOURCE OF DISCOVERY Private Practitioner Chest Clinic .. Sanatorium Hospital Repatriation Dept. Contact Follow-up Mantoux Testing Mass X-ray Survey— Health Dept. Anti-T.B. Assoc. Other Death Certificate Total 3 i 1 5 1 37 35 115 31 31 15 5 5 14 19 1 43 22 51 25 13 2 1 1 3 58 27 59 24 24 9 io 4 24 28 61 3 33 3 2 . . 8 7 3 4 1 l 2 5 3 2 1 1 55 24 70 20 11 1 l . . 61 27 124 32 19 2 i * * 11 6 20 6 1 60 i9 5 337 156 478 144 103 29 18 11 40 50 60 19 AGE-GROUP (YEARS) Under 1 1-4 .. 5-9 10-14 .. 15-19 .. 20-24 25-29 30-34 35-39 40-44 45-49 50-54 55-59 60-64 65-69 70-74 75 and over Not Stated All Ages 1 2 i l 3 2 S 3 7 13 11 22 31 44 43 44 27 21 30 21 11 2 6 2 5 13 14 18 16 10 15 16 7 11 6 4 3 3 2 2 4 11 14 33 40 45 52 60 49 60 38 35 30 3 i *7 6 10 10 20 14 20 8 7 11 12 4 13 3 4 4 5 10 12 9 14 13 9 7 13 1 2 6 2 4 2 4 3 '5 2 1 3 3 1 2 2 '3 i 1 3 1 1 2 i i 1 12 3 1 2 4 1 3 4 ’2 1 3 1 2 1 9 2 1 2 6 4 4 9 5 1 2 2 1 2 2 5 6 11 7 10 19 1 2 1 1 1 1 4 2 4 2 5 5 337 156 478 144 103 29 18 11 40 50 60 19 Total M. F. P. 202 106 308 108 52 160 1 1 178 95 273 99 3 102 14 11 25 5 9 14 137 45 182 205 62 267 32 12 44 60 19 79 1,041 414 1,455 1 16 20 1 36 10 9 19 7 5 12 16 15 31 32 29 61 33 31 64 65 39 104 80 50 130 100 35 135 113 38 151 121 29 150 99 22 121 108 25 133 85 25 110 75 12 87 75 25 100 5 5 10 1,041 414 1,455 Table IX—Comparison of Form and/or Stage of Disease for 1960, as Compared with 1961 Form and/or Stage of Disease 1960 1961 Number Percentage of Total Number Percentage of Total Primary .. Minimal Moderately Advanced . ” Far Advanced .. .. .. .. .. [[ Pleural Effusion .. .. .. .. Extra Pulmonary .. .. .. .. ’ ’ Death Certificate . * ] 496 675 156 11 78 117 32.35 44.04 10.17 0.72 5.08 7.64 10 493 622 132 29 90 79 0.6 33.9 42.8 9.1 2.0 6.2 5.4 1,533 100.0 1,455 100.0](https://iiif.wellcomecollection.org/image/b31485522_0094.jp2/full/800%2C/0/default.jpg)