[Report 1949] / Medical Officer of Health, Essex County Council.
- Essex (England). County Council.
- Date:
- 1949
Licence: Attribution 4.0 International (CC BY 4.0)
Credit: [Report 1949] / Medical Officer of Health, Essex County Council. Source: Wellcome Collection.
101/104 (page 101)
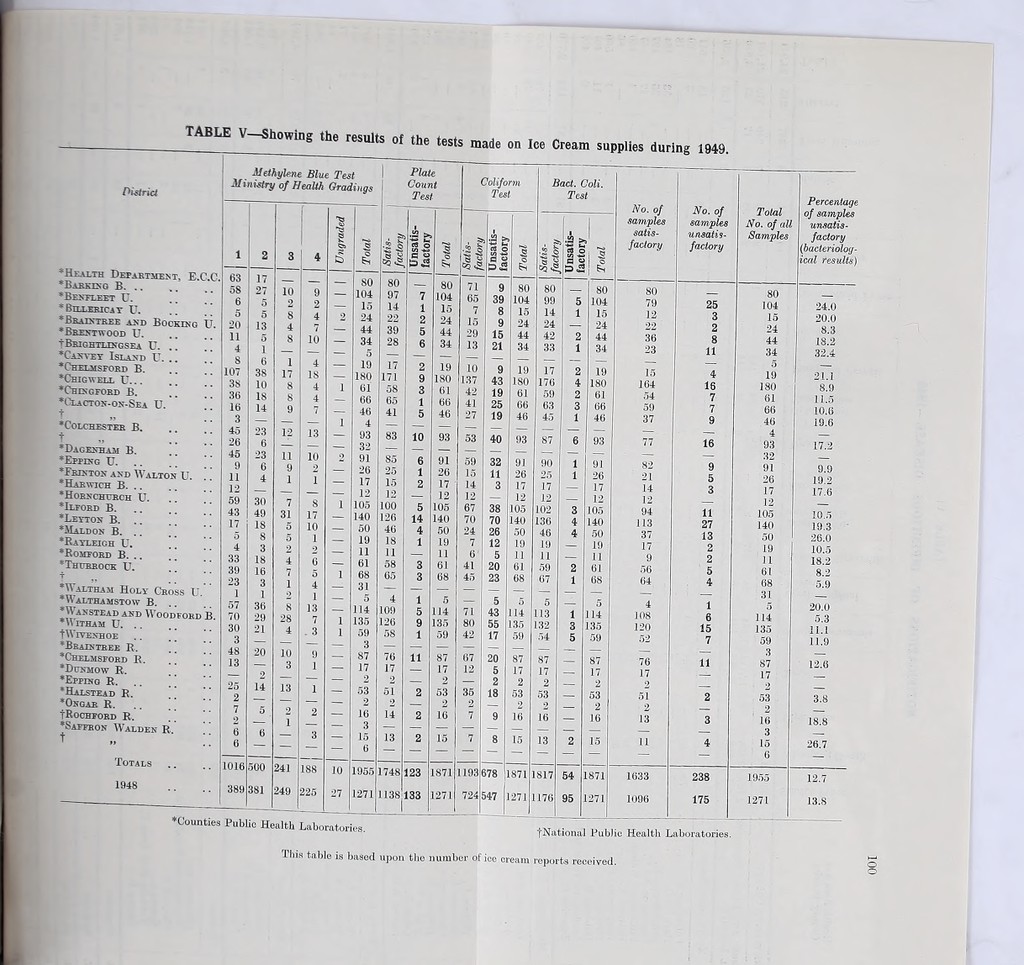
![■ wuu wing District ♦Health Department, E.C.C. ♦Barking B. .. ♦Benfleet U. * Billerica y U. '. *Braintree and Booking U. ♦Brentwood U. t Brightlingsea U. .. ♦Canyby Island U. !! ♦Chelmsford B. ♦Chigwell U... ♦Chingford B. * Clacton-on-Sea U. f js * Colchester B. f H * Dagenham B. ♦Epping U. ♦Frinton and Walton U. ’Harwich B. .. *Hornchurch U. ♦Ilford B. ♦Leyton B. .. ’ [ ♦Maldon B. .. ’ ’ ♦Rayleigh U. ♦Romford B. .. ♦Thurrock U. t Waltham Holy Choss U. ♦Walthamstow B. anstead and Woodford ♦WlTHAM U. tWlVENHOE . . * [ ♦Braintree R. . * ♦Chelmsford R. ’ ] ♦Dunmow R. ♦Epping R. ♦Halstead R. ’' ♦Ongar R. tR0CHF0RD R. .' ♦Saffron Walden R. Totals 1948 Methylene Blue Test Ministry of Health Gradings 1 2 3 4 63 17 __ 58 27 10 9 6 5 2 2 5 5 8 4 20 13 4 11 5 8 10 4 1 8 6 1 4 107 38 17 18 38 10 8 4 36 18 8 4 16 14 9 3 — 45 23 12 13 26 6 __ 45 23 11 10 9 6 9 2 11 12 4 1 1 59 30 7 8 43 49 31 17 17 18 5 10 5 8 5 1 4 3 2 2 33 18 4 6 39 16 7 23 3 1 4 1 1 2 1 57 36 8 13 70 29 28 7 30 21 4 . 3 3 — — 48 20 10 9 13 3 1 25 14 13 1 2 — — 7 5 2 2 — 1 6 6 — 3 6 — — — 1016 500 241 188 389 381 249 225 80 104 15 24 44 34 5 19 180 61 66 46 4 93 32 91 26 17 12 105 140 50 19 11 61 68 31 5 114 135 59 3 87 17 2 53 2 16 3 15 6 1955 1271 Counties Public Health Laboratories. | Plate Count Test Coliform Test Satis- factory Unsatis- factory | Total •ij <§*2 Unsatis- factory Total 80 — 80 71 9 80 97 7 104 65 39 104 14 1 15 7 8 15 22 2 24 15 9 24 39 5 44 29 15 44 28 6 34 13 21 34 — —- — 17 2 19 10 9 19 171 9 180 137 43 180 58 3 61 42 19 61 65 1 66 41 25 66 41 5 46 27 19 46 — -—- — —H 83 10 93 53 40 93 — — — — 85 6 91 59 32 91 25 1 26 15 11 26 15 2 17 14 3 17 12 — 12 12 12 100 5 105 67 38 105 126 14 140 70 70 140 46 4 50 24 26 50 18 1 19 7 12 19 11 11 6 5 11 58 3 61 41 20 61 65 3 68 45 23 68 — — — — — 4 1 5 — 5 5 109 5 114 71 43 114 126 9 135 80 55 135 58 1 59 42 17 59 — — — — — 76 11 87 67 20 87 17 — 17 12 5 17 2 — 2 — 2 2 51 2 53 35 18 53 — 2 2 — 2 14 2 16 7 9 16 13 2 15 7 8 15 1748 123 1871 193 678 871 1138j 133 1271 724 547 | 271 Bad. Coli. Test , sji j & e« c e « a < 90 25 17 12 102 136 46 19 11 59 67 5 113 132 54 87 17 2 53 13 1817 1176 80 104 15 24 44 34 19 180 61 66 46 15 1871 1271 No. of samples satis- factory 80 79 12 22 36 23 15 164 54 59 37 82 21 14 12 94 113 37 17 9 56 64 4 108 120 52 76 17 11 1633 1096 No. of samples unsatis- factory 25 3 2 8 11 4 15 7 7 9 16 9 5 3 11 27 13 2 2 1 6 15 7 238 175 Total No. of all Samples 104 15 24 44 34 5 19 180 61 66 46 4 93 32 91 26 17 12 105 140 50 19 11 61 68 31 5 114 135 59 3 87 17 2 53 2 16 3 15 6 1955 1271 Percentage of samples unsatis- fadory (bacteriolog- ical results) 24.0 20.0 8.3 18.2 32.4 21.1 8.9 11.5 10.6 19.6 17.2 9.9 19.2 17.6 10.5 19.3 26.0 10.5 18.2 8.2 5.9 20.0 5.3 11.1 11.9 12.6 3.8 18.8 26.7 12.7 13.S tNational Public Health Laboratories. This table is based upon the number of ice cream reports received.](https://iiif.wellcomecollection.org/image/b2919605x_0103.jp2/full/800%2C/0/default.jpg)