Contribution to the statistics of pneumonia / by Arthur Mitchell.
- Mitchell, Arthur, Sir, 1826-1909.
- Date:
- [1857]
Licence: Public Domain Mark
Credit: Contribution to the statistics of pneumonia / by Arthur Mitchell. Source: Wellcome Collection.
2/8 (page 2)
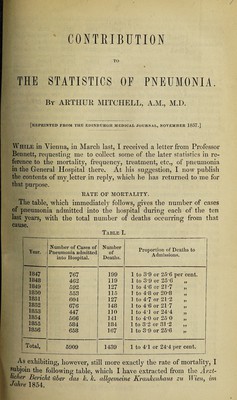
![1851. 1852. 1853. 1854. 765 74-9 74-5 7o-o , 2-7 2-3 1-9 3-4 20-8 22-8 23-6 26-6 100-0 100-0 100-0 100-0 55 In comparing the years embraced in Table II., with the same, years in Table I, a slight discrepancy will be observed. This is accounted for thus:—In the first table, the per centage of deaths is drawn from the number of admissions, whereas, in the second, it is derived from the number treated each year, the treatment being concluded by successful, fatal, or other issue. The last is influenced, therefore, by the number remaining from the preceding and that passed over to the succeeding year, as well as by transferences during the year. This does not affect, however, to any important extent, the final result of Table I., which shows 24*4 per cent, as the average mor¬ tality. For obvious reasons, this is the case. And we have a demonstration in calculating the means for the four years comprised in both tables, when the results will be found to be almost the same, viz., 23T and 23'5°/0. The greater the number of years, of course, the less will be the discrepancy. One year, however, shows a strikingly different rate of mortality from another—ranging from 20*8 to 31*2 per cent. But the general line of treatment, pursued in the Vienna Hospital during the last ten years, so far as I know, has remained nearly the same, or at any rate has not been undergoing material or essential changes. We might be apt to suppose, therefore, that this changing rate of mor¬ tality had resulted from alterations in the type of the disease. But, as the following Table1 will show, the same varying result of treatment may be observed during the course of one year. Table III. 1849. Different Medical Divisions. Number Treated. Number of Deaths. Proportion of Deaths to Cases Treated. Male. Female. Male. Female. Male.] Female. I. Division, 57 16 14 8 24-5 50-0 II. „ 36 34 6 7 16-6 20-6 III. „ 46 11 15 3 32-6 27'2 IV. „ 19 37 6 9 31-5 24-3 v. „ 37 30 8 7 21-6 26-6 VI. „ Div. for disease 1 69 25 16 4 23-2 16-0 of chest (spe- > cial), . ) 82 39 11 6 13-4 15-4 In this table, it will be observed that the pneumonias are spread 1 Report for 1849.](https://iiif.wellcomecollection.org/image/b3056315x_0002.jp2/full/800%2C/0/default.jpg)