Report on schools of public health in the United States : based on a survey of schools of public health in 1950 / Leonard S. Rosenfeld [and others].
- United States. Division of Public Health Methods
- Date:
- 1953]
Licence: Public Domain Mark
Credit: Report on schools of public health in the United States : based on a survey of schools of public health in 1950 / Leonard S. Rosenfeld [and others]. Source: Wellcome Collection.
113/124 page 101
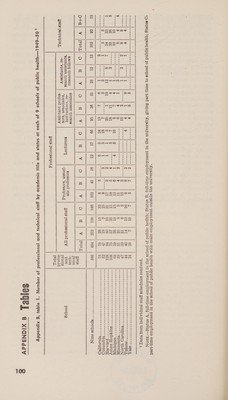
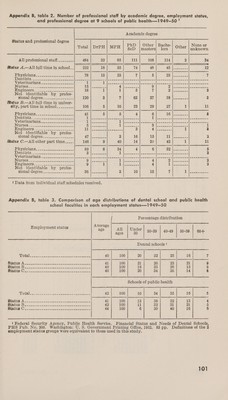
![Appendix B, table 2. Number of professional staff by academic degree, employment status, and professional degree at 9 schools of public health—1949—50 * Academic degree Status and professional degree PhD | Other | Bache- None or Total | DrPH | MPH ScD |masters| lors Other unknown | | | | | | | All professional staff___.....- 484 ove 85 111 106 114 2 34 eaaeeeaeeds | saeeateetnsesanenaas | cepepeaeemestasseamaaess: | \Carmeeeentanigs=omaaaeaan | | sapeesememanastecancases’ || seceemeameemeenaaeaaans | ooceneeienseaeensesasacss: | anomeeoeeeanmmenenteeareneeel Status A.—All full time in school-_- 232 18 35 74 48 45 tiene ce 12 IBV SIGIQTI Ge. eet or ies a 78 13 23 if 5 PE) Wasaga eo 7 MET US US ec ee ee se eae ee ee ae ed ia AS Ns tice Se EO LN ce ai ee Moeterinarigns:. 220... st 1 TA | see g sl Bl I ti UME EAS Vk ge kt HEIN MORAY Ee INET GG GS i cn es Sy 155d (eee cg) aoe Aone 9 Ge cate tae aks ts a aa cim Ceres 22 some ee ae 18 1 1 5 7 Da eee 2 Not identifiable by profes- sionslidéeree. 2 2 ee 120 3 7 62 27 sol eee 3 Matus B.—A]l full time in univer- ~ sity, part time in school____..-_- 106 5 10 23 29 27 1 il Ipbysiciaris. = oso ee 41 5 5 4 6 5 (aa epee eae 6 DEMCIStSE at eee ee ere eee Ju aeaolte ae (kane en >. | DR cRe a mS 1 ie PR Foal fe pa SNS) a Ee ne Veterinarians. 2.25 > eae SNE, |e A ee 3 Kea] | sere ve | rele oe) (eae. nce | nas le ie IN GRSaS 4 eee fi} |e Se, 1 S| | ee ee OF ecsec an ec ee 1 I Hagia Ee) eee, oe eS SE ee DG oe ae Ss 3 Gi cee aes 1 3 Not identifiable by profes- slonal- degree. -2.-4. 5.2 5.022 Oi le ee 3 16 15 | Nh Dkr, 2 Status C.— All other part time___.- 146 9 40 14 29 42 A 11 (PIV SIGIANS. eee eae eee 89 8 34 4 6 S2ieeeeLess § POOHEISUS! oo eee ce SE es ca eee Up as as | eh ieee leet eI | ee ee 2 WIGUERIDATIGI Geto as oe ea ee ge aa ee ees reek Te ee ee me cps a ee NURS OS ing bok ee a ten (2) (eee ee tt eer 4 Je eee Ee 2 Hneingerga: = eo: ee 9 1 uf (ase ee 4 Te ees ee 2 Not identifiable by profes- sional degree... 5-2-3 ee Sotho ss ee 3 10 15 Tate | al ee pee 1 Data from individual staff schedules received. Appendix B, table 3. Comparison of age distributions of dental school and public health school faculties in each employment status—1949—50 Percentage distribution Average Employment status s ge All | Under if ages 30 30-39 | 40-49 | 50-59 60-+- Dental schools ! I OUN nd pa studies te cae cees ee etaeeee 40 100 20 32 25 16 7 UD) MaRS Oe iA OS ERS TEE EEE OES! S 41 100 21 26 23 21 9 oa kt fi 5 EI OME TE ED SRD RET IE oe 40 100 18 33 26 15 8 MCGtOS © oo oe ee ee a eae 40 100 20 34 26 14 6 Schools of public health OURS As Spcins scope cee a tees eee ace 42 100 10 34 35 16 5 WAGE At 25 Acne acuadnanene cede eoeadecuees 41 100 13 38 32 13 4 Oe ae eee eee seer eee ee ie 42 100 11 32 31 21 5 MEAUUE NT) ass nace cs amoncesiaceusese tee 44 100 6 30 40 16 8 1 Federal Security Agency, Public Health Service. Financial Status and Needs of Dental Schools, PHS Pub. No. 200. Washington: U. S. Government Printing Office, 1952. 83 pp. Definitions of the 3 employment status groups Were equivalent to those used in this study.](https://iiif.wellcomecollection.org/image/b32172473_0113.jp2/full/800%2C/0/default.jpg)