Experimental study of children : including anthropometrical and psycho-physical measurements of Washington school children, and a bibliography / by Arthur MacDonald.
- MacDonald, Arthur, 1856-1936.
- Date:
- 1899
Licence: Public Domain Mark
Credit: Experimental study of children : including anthropometrical and psycho-physical measurements of Washington school children, and a bibliography / by Arthur MacDonald. Source: Wellcome Collection.
28/338 (page 1006)
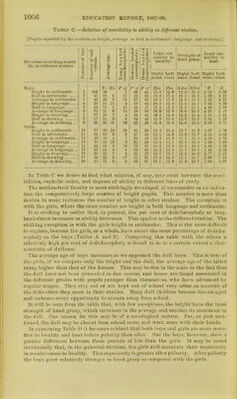
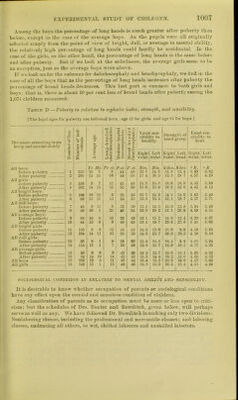
![100G Tablic C.—Relation of sensibility to ability in different studies. [Tupila reported by the teachers as bright, average, or dull iu arithmetic, language, and drawing.] Divisions according to abil • ity in (litterenl studies. © %- o © © .s c eg f- p © <£> So CD © to cfl *3 © © jz w Cg eg ° aT rS © . o fl P © 3 ^ 3 r3 - £ © §| ~ Pi c y 'P eg cgpa © P* _ © — o Least sen sibility to locality. Strength of hand grasp. Least sen- sibility to heat. A 5 'A © > - ■/) r— Oi a - c: © © «s Eight wrist Left wrist Right hand Left hand Right wrist. Left wrist. Boys: Tr Mo P ct P ct. P ct Mm Mm Kilos. Kilos °R. 0 R. Briglit in arithmetic... 1 108 10 7 49 44 15 5 14 0 13.8 13 2 3.35 3. 00 Dull in arit hmetic 2 45 12 0 17 45 38 15 0 15.4 16. 3 15.9 3. 56 3.27 Average in arithmetic. 3 48 10 8 13 37 50 16 3 15 6 14.5 13 9 4 22 4 93 Bright in languago 4 56 10 11 4 50 46 10 5 15.2 15. 5 14. 7 3 54 3 70 Dull in language 5 28 13 3 23 40 37 15.9 10. 2 21 9 21 3 4 40 3. 99 Average iu language .. C 50 11 G 14 30 56 16.6 15 8 16.8 16 8 4 25 4 17 Bright in drawing 7 57 10 7 4 54 42 16 4 14.0 14.2 13 4 3.18 3 25 Dull in drawing 8 23 n 9 6 54 40 15 5 15.6 15.6 15.5 3. 92 3 32 Average in drawing ... Girls: 9 26 10 10 10 45 45 15.9 15.3 14.0 13.8 3 59 3. 75 Bright in arithmetic ... 10 73 10 10 20 51 29 14. 5 13.4 12.7 11.8 3.97 3 39 Dull in arithmetic 11 34 12 6 9 47 44 17. 1 14.8 13.9 13.7 4. 15 4.03 Average in arithmetic . 12 16 10 4 7 50 43 13.2 12. 9 11.5 11.0 4. 20 3 78 Bright in language 13 73 13 Ur 9 61 30 14.4 13. 5 20.0 18.3 3.88 3. 86 Dull in language 14 44 15 8 10 59 31 14. 6 13.9 20. 2 19.2 4. 44 3.99 Average in language .. 15 25 14 4 8 52 40 14. 2 13.0 19.7 18.3 3.48 3.32 Bright in drawing 16 30 12 7 8 55 37 13. 7 12.7 16.3 14.9 3.77 3.15 Dull in drawing 17 18 12 9 17 22 61 17.4 14.6 15. 1 14.7 3.96 3.85 Average iu drawing ... 18 13 12 0 9 30 61 13. 1 12.8 13.8 12.7 3. 96 3. 87 In Table C we desire to find what relation, if any, may exist between the sensi- bilities, cephalic index, and degrees of ability in different lines of study The arithmetical faculty is most strikingly developed, if we consider as an indica- tion the comparatively large number of bright pupils. This number is more than doublo in many instances the number of bright in other studies. The exception is with the girls, where the same number are bright iu both language and arithmetic. It is striking to notice that, iu general, the per cent of doliehocephaly or long- headedness increases as ability decreases. Tins applies to the different studies. The striking exception is with the girls bright in arithmetic, 'this is the more difficult to explain, because the girls, as a whole, have about the same percentage of dolicho- cephaly as the boys (Tables A aiulB). Comparing this table with the others a relatively high per cent of doliehocephaly is found to be to a certain extent a char- acteristic of dullness. The average age of boys increases as we approach the dull boys. This is true of the gills, if we compare only the bright and the dull, the average age of the latter being higher than that of the former. This may be due in the main to the tact that the dull have not been promoted in due course, and hence are found associated iu the different grades with pupils younger than themselves, who have advanced by regular stages. They stay out or are kept out of school very often on account of the difficulties they meet in their studies. Many dull children become discouraged and embrace every opportunity to remain away from school. It will be seen from the table that, with few exceptions, the bright have the least strength of hand grasp, which increases in the average and reaches its maximum in the dull. One reason for this may be of a sociological nature. For, as just men- tioned, the dull may be absent from school more, and work moro with their hands. In examining Table D it becomes evident that both boys and girls are more sensi- tive to locality and heat before puberty than after. But the boys, however, show a greater difference between tlieso periods of life than the girls. It may be noted incidentally that, in the pubertal division, the girls still maintain their superiority in sensitiveness to locality. This superiority is greater after puberty. After puberty the boys grow relatively stronger in hand grasp as compared with the girls.](https://iiif.wellcomecollection.org/image/b2811663x_0028.jp2/full/800%2C/0/default.jpg)