Experimental study of children : including anthropometrical and psycho-physical measurements of Washington school children, and a bibliography / by Arthur MacDonald.
- United States. Bureau of Education.
- Date:
- 1899
Licence: Public Domain Mark
Credit: Experimental study of children : including anthropometrical and psycho-physical measurements of Washington school children, and a bibliography / by Arthur MacDonald. Source: Wellcome Collection.
Provider: This material has been provided by the Royal College of Physicians of Edinburgh. The original may be consulted at the Royal College of Physicians of Edinburgh.
30/344 (page 1006)
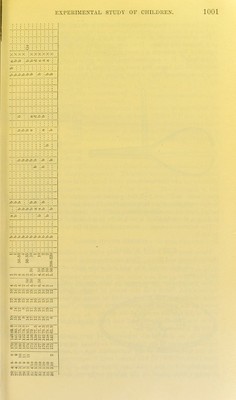
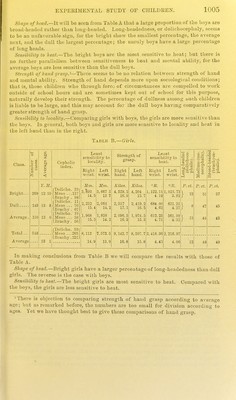
![Table C.—Relation ef sensihility to abilUij in different aludiea. [Pupils reported by tbo tcacbers as brijjbt, average, or dull in .arithmetic, language, and drawing.] Divisions .according to abil- ity in diticrent studies. 6 o CJ a H 'A ^-3 o a f-t P r Average age. 2 & 1—> o ■ o a ^ Hi E -3 • a ~ © 7i p. c a P CJ P o -* X CJ 3 3- CJ P. - CJ '— _5J -S SI CJ p c: (3 £, Least sen- sibility to localitij'. Strength of band grasi). Lea.st sen- sibility to beat. Right wrist. Left (Vrist Right tiand. Loft haiid Ri^ht wrist. Left wrist. Boys: rr Mo P. ct. P Ct. P c{ Sim Mm Kilos. Kilos. °R. ^R. Brisbt in .arithmetic... 1 108 10 7 49 44 15.5 14.0 13.8 13 2 3.35 3.00 2 45 12 0 17 45 38 15 0 15.4 10.3 15. 9 3. 50 3.27 Average in arithraetic. 3 4S 10 8 13 37 50 16 3 15.6 14.5 13 9 4.22 4.03 Bright in language 4 5(i 10 11 4 50 46 10.5 15.2 15.5 14. 7 3 51 3 70 Dull in language 5 28 13 3 23 40 37 15.9 16.2 21.9 21 3 4.40 3. 99 Average in language .. 6 .50 11 6 14 30 56 16.6 15 8 10.8 10 8 4.25 4 17 Bright in drawing 7 57 10 7 4 54 42 16 4 14.0 14.2 13 4 3.18 3 25 DuU in drawing 8 23 11 9 0 54 40 15.5 15.0 15.0 15 5 3.92 3 32 Average in drawing... 9 20 10 10 10 45 45 15.9 15.3 14.6 13 8 3.59 3.75 Girls: Brigbt in arithmetic.. - 10 10 10 on Dl nn t^J 14.5 13.4 12.7 11 8 3.97 3.39 Dull in aritlimetic 11 U 12 6 9 47 44 17.1 14.8 13.9 33 7 i. 15 4.03 Average in arithmetic. 12 10 10 4 7 50 43 13.2 12.9 11.5 11 0 4. 20 3.78 Bright in langu.ago 13 73 13 It 9 01 30 14.4 13. 5 20.0 18 3 3.88 3. 86 Dull in language 14 44 15 8 10 59 31 14.6 13.9 20. 2 19 2 4. 44 3.S9 Avor.age in language .. 15 25 14 4 8 52 40 14.2 13.0 19.7 18 3 .3. 48 3.32 Bright in drawing 10 30 12 7 8 55 37 13.7 12.7 10.3 14 9 3.77 3.15 Dull in drawing 17 18 12 9 17 22 61 17.4 14.0 15.1 14 7 3.96 3.85 Average in drawing ... IS 13 12 0 9 30 01 13.1 12,8 13.8 12 7 3.96 3. 87 lu Table C we desire to find wliat relation, if aay, may exist between tlie sensi- Lilities, cephalic index, and degree.? of ability in ditferent lines of study. Tbo .trithmetical faculty is most strikingly devolo]>edj if reconsider as an indica- tion tbo comparatively large number of brigbt pupils. This number is more than double in many instances the number of bright in other studies. The exception is ■with the girls, where the same number are bright in both language and arithmetic. It is striking to notice that, in general, the per cent of dolichocephaly or Jong- headedness increases as ability decreases. Tins applies to the difi'ereut studies. The striking exception is ■with the girls bright in arithmetic. This is the more difficult to explain, because the girls, as a whole, have about the same jjerccntago of dolicho- cephaly as the boys (Tables A andB). Comparing this table ^vith the others a relatively high per cent of dolichocephaly is found to bo to a certain extent a char- acteristic of dullness. The average age of boys increases as we approach the dull boys. This is true of the girls, if we compare only the bright and the dull, the average age of the latter l)eing higher than that of tlie former. This may be due in the main to the fact that the dnll have not been promoted in due course, and hence are found associated in the difi'ereut grades -with pupils younger than tliemselves, who have advanced by regul.ir stages. They stay out or are kejit out of school very often on account of the difficulties they meet in their studies. Many dull children become discouraged and embrace every opportunity to romaiu away from school. It will bo seen from the table that, with few exceptions,.tho bright have the least strength of hand grasp, which increases in the average and reaches its maximum in the dull. One reason for this may be of a sociological nature. For, as just men- tioned, the dull may be absent from scliool more, and work more with their hands. In examining Table D it becomes evident that both boys and girls are more sensi- tive to locality and heat before puberty than after. Cut the boy., however, show a greater difference betiveeu these periods of lifo than the girls. It may bo noted incidentally that, in the pubertal division, the girls still maintain their superiority in sensitiveness to locality. This superiority is greater after puberty. After puberty tho boys grow relatively stronger in hand grasp as compared witli the girls.](https://iiif.wellcomecollection.org/image/b21730593_0030.jp2/full/800%2C/0/default.jpg)