[Report 1955] / Medical Officer of Health, Workington Borough.
- Workington (England). Borough Council.
- Date:
- 1955
Licence: Attribution 4.0 International (CC BY 4.0)
Credit: [Report 1955] / Medical Officer of Health, Workington Borough. Source: Wellcome Collection.
25/36 (page 23)
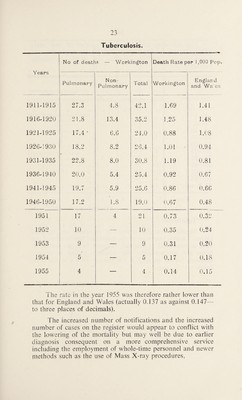
![Tuberculosis. Years No of deaths — Workington Death Rate per 1,000 Pop. ] Pulmonary Non- Pulmonary Total Workington England and Wa cs 1911-1915 27.3 4.8 42.1 1.69 1.41 1916-1920 21.8 13.4 35.2 1.25 1.48 1921-1925 17.4 • 6.6 24.0 0.88 1.08 1926-1930 18.2 8.2 26.4 1.01 * 0.94 1931-1935 22.8 8.0 30.8 1.19 0.81 1936-1940 20.0 5.4 25.4 0.92 0.67 1941-1945 19.7 5.9 25.6 0.86 0.66 1946-1950 17.2 1.8 19.0 0.67 0.48 1951 17 4 21 0.73 0.32 1952 10 — 10 0.35 0.24 1953 9 — 9 0.31 0.20 1954 5 — 5 0.17 0.18 1955 4 — 4 ■ 0.14 0.15 The rate in the year 1955 was therefore rather lower than that for England and Wales (actually 0.137 as against 0.147— to three places of decimals). The increased number of notifications and the increased number of cases on the register would appear to conflict with the lowering of the mortality but may well be due to earlier diagnosis consequent on a more comprehensive service including the employment of whole-time personnel and newer methods such as the use of Mass X-ray procedures,](https://iiif.wellcomecollection.org/image/b30293492_0025.jp2/full/800%2C/0/default.jpg)