Hospital construction and management / by Frederic J. Mouat and H. Saxon Snell.
- Date:
- 1889
Licence: Public Domain Mark
Credit: Hospital construction and management / by Frederic J. Mouat and H. Saxon Snell. Source: Wellcome Collection.
Provider: This material has been provided by the Royal College of Physicians of Edinburgh. The original may be consulted at the Royal College of Physicians of Edinburgh.
60/588 page 34
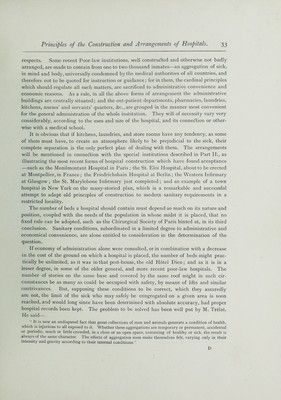
![Dr. Farr, in the Twenty-fourth Annual Report of the Registrar-General (p. 230), constructed a table to show the relative mortality of hospitals, based upon the number of their inmates. Principal General Hospitals in England and Wales, 1861. (Special Hospitals excluded from this Table.) Number of Hospitals. Inmates. Average number of Inmates in each Hospital. Deaths. Mortality per cent. Hospitals containing 300 inmates and upwards 5 2,090 418 2,101 10053 200 and under 300 4 913 239 838 9178 100 and under 200 22 2,898 132 2,041 7043 Under 100 49 2.634 54 1,240 4708 Total i 80 8.535 107 6,220 7288 It is obvious that there are so many sources of fallacy underlying such a statement, so many conditions necessary to be understood are not mentioned, so much difference in the classes of sick admitted to such institutions, and the period over which the inquiry extends is itself so extremely limited, that the table is of no further scientific value than as embodying a rough approximation to what may prove to be a truth, on a more extended and strictly scientific examination. Mr. Lawson Tait has constructed tables on a wider and more reliable basis for determining the same question, with a nearer approach to accuracy, as the following statement shows:— Summary of those Hospitals (179) from which Complete Information was Obtained. (Arranged in Groups, according to the number of Beds in average occupation.) Average Average Mean Mortality per District Remarks. No. Period of Observation—1861-70. Beds Residence cent, of Mortality Occupied. each Bed. in Days. Beds. Patients. per i.ooo. 1. 54 Hospitals under 5 beds 2*82 12* 345 6292 5-03 20*14 /In this III. Group there I are 6 hospitals, with an 11. 12 Hospitals from 5 to 9 beds 6'82 11*14 32-03 5997 5*02 21*25 hi. 26 ,, ,, 10 to 19 ,, 1344 11-3 3223 79-77 7*00 21* J 11'57 and if these were ] eliminated the average IV. 8 ,, 20 to 29 ,, 25' 9'4 3965 46-16 5-63 21* 1 mortality of the 20 1 others would be 5*636, V. 6 ., 30 to 39 „ 33 96 9-88 35-12 58-09 5'94 22-3 \and the bed rate 61*26. VI. 8 ,, 40 to 49 ,, 4377 96 40-17 57-06 5-97 22'3 VII. II <> .. 50 to 74 „ 6188 1035 36-33 61-69 5-77 21-8 VIII. 15 ,. 75 to 99 ,, 8405 n'08 34-26 77-54 6-66 24-13 IX. IO ,, ,, 100 to 124 ,, II335 11-85 32-48 79-18 6-7 24- X. 17 ,, 125 to 199 ,, I43-74 11-95 31-46 93-34 7-92 24-92 XI. 5 ,, 200 to 299 ,, 211*91 1239 30-18 11885 9-15 3°-6 / if the mortality were the XII. 7 over 300 beds 4I73 1074 33-38 10153 9-6 25- 1 same in XII. as it is in -( XI. (that is *433 less), 140 lives a year would Vbe saved. Regarding this table, Mr. Tait remarks, as all statists hold it to be, “that if the employment of large masses of figures enables us to get rid of minor errors, I think I](https://iiif.wellcomecollection.org/image/b21911319_0060.jp2/full/800%2C/0/default.jpg)