Dr. W.W.E. Fletcher's report to the Local Government Board on the urban districts of Longton and Fenton, in the county of Staffordshire, in reference to long-sustained and highly-fatal prevalence of diphtheria therein / [Wilfred W.E. Fletcher].
- Fletcher, Wilfred W. E.
- Date:
- 1898
Licence: Public Domain Mark
Credit: Dr. W.W.E. Fletcher's report to the Local Government Board on the urban districts of Longton and Fenton, in the county of Staffordshire, in reference to long-sustained and highly-fatal prevalence of diphtheria therein / [Wilfred W.E. Fletcher]. Source: Wellcome Collection.
12/38 page 12
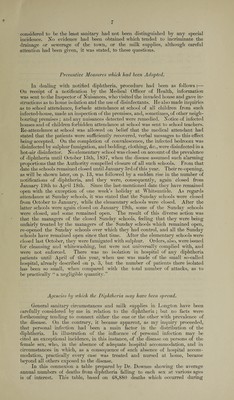
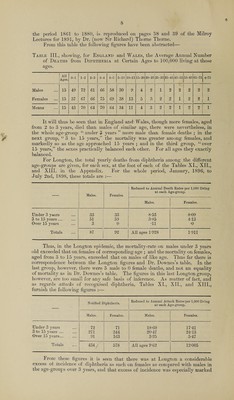
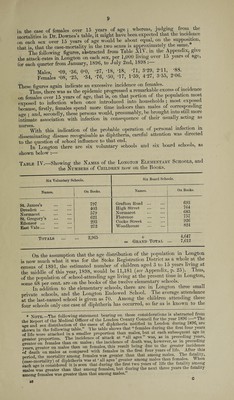
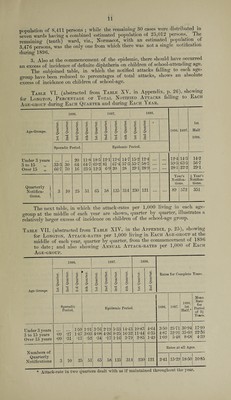
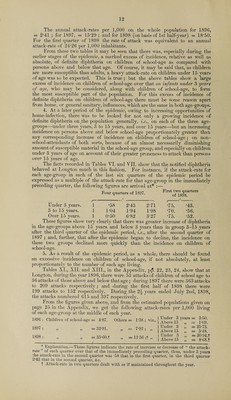
![The annual attack-rates per 1,000 on the whole population for 1896, = 2’41 ; for 1897, = L5*29 ; and for 1898 (on basis of 1st half-year) = 18'50. For the first quarter of 1898 the rate of attack was equivalent to an annual attack-rate of 2426 per .1,000 inhabitants. From these two tables it may be seen that there was, especially during the earlier stages of the epidemic, a marked excess of incidence, relative as well as absolute, of definite diphtheria on children of school-age as compared with persons above and below that age. Of course, it may be said that, as children are more susceptible than adults, a heavy attack-rate on children under 15 years of age was to be expected. This is true ; but the above tables show a large excess of incidence on children of school-age over that on infants under 3 years of aye, who may be considered, along with children of school-age, to form the most susceptible part of the population. For this excess of incidence of definite diphtheria on children of school-age there must be some reason apart from home, or general sanitary, influences, which are the same in both age-groups. 4. At a later period of the epidemic, owing to increasing opportunities of home-infection, there was to be looked for not only a growing incidence of definite diphtheria on the population generally, i.e., on each of the three age- groups—under three years, 3 to 15 years, and over 15 years—but an increasing incidence on persons above and below school-age proportionately greater than any corresponding increase of incidence on children of school-age ; on non¬ school-attendants of both sorts, because of an almost necessarily diminishing1 amount of susceptible material in the school-age group, and especially on children under 3 years of age on account of their greater proneness to attack than persons over 15 years of age. The facts recorded in Tables VI. and VII. show that the notified diphtheria behaved at Longton much in this fashion. For instance, if the attack-rate for each age-group in each of the last six quarters of the epidemic period be expressed as a multiple of the attack-rate for that age-group in the immediately preceding quarter, the following figures are arrived at* :— Four quarters of 1897. First ^quarters r - v *\ ,-^ --s Under 3 years. 1 *58 2*43 2*71 •75. •43. 3 to 15 years. 1 1*04 1*94 1*98 •70. •56. Over 15 years. 1 0*50 6*82 3-27 •75. *52. These fi gures show very clearly that there was greater increase of diphtheria in the age-groups above 15 years and below 3 years than in group 3-15 years after the third quarter of the epidemic period, i.e., after the second quarter of 1897 ; and, further, that after the epidemic began to decline, the incidence on these two groups declined more quickly than the incidence on children of school-age. 5. As a result of the epidemic period, as a whole, there should be found an excessive incidence on children of school-age, if not absolutely, at least proportionately to the number of such age living. Tables XI., XII. and XIII., in the Appendix, p]3. 22, 23, 24, show that at Longton, during the year 1896, there were 53 attacks of children of school age to 36 attacks of those above and belo w that age ; during 1897 there were 363 attacks to 209 attacks respectively ; and during the first half of .1898 there were 199 attacks to 152 respectively. During the 2^ years ended July 2nd, 1898,. the attacks numbered 615 and 397 respectively. From the figures given above, and from the estimated populations given on page 25 in the Appendix, we get the following attack-rates per 1,000 living- of each age-group at the middle of each year. 4*87. Others = 1*38 ; viz., 1896 : Children of school-age = 1897 1898 = 32-91. = 35*60-t = 7-92 ; = 11-36 ;f j Under 3 years = 3*50. 1 Above 15 „ == 1-09. j Under 3 „ = 25*73. ( Above 15 „ = 5*48. Under 3 „ = 30*94. f Above 15 „ = 8*68.f * Explanation.—These figures indicate the rate of increase or decrease of “ the attack- rate ” of each quarter over that of the immediately preceding quarter, thus, under 3 years the attack-rate in the second quarter was *58 that in the first quarter, in the third quarter 2*43 that in the second quarter, &c.](https://iiif.wellcomecollection.org/image/b30557768_0012.jp2/full/800%2C/0/default.jpg)