[Report 1957] / Medical Officer of Health, Gosport Borough.
- Gosport (England). Borough Council.
- Date:
- 1957
Licence: Attribution 4.0 International (CC BY 4.0)
Credit: [Report 1957] / Medical Officer of Health, Gosport Borough. Source: Wellcome Collection.
11/40 (page 9)
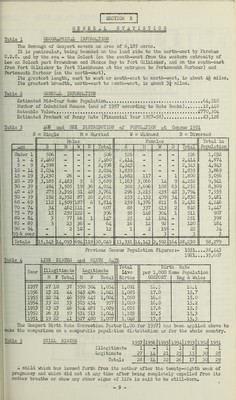
![GENERAL STATISTICS Table 1 GEOGRAPHICAL INFORMATION The Borough of Gosport covers an area of 6,185 acres. It is peninsular, being bounded on the land side to the north-west by Fareham U.D.C. and by the sea - the Solent (on the south-west from the western extremity of Lee on Solent past Browndown and Stokes Bay to Fort Gilkicker, and on the south-east from Fort Gilkicker to Fort Blockhouse at the entrance to Portsmouth Harbour) and Portsmouth Harbour (on the north-east). Its greatest length, east to west or south-east to north-west, is about 4^ miles. Its greatest breadth, north-east to south-west, is about 3^ miles. Table 2 GENERAL INFORM *11 ON Estimated Mid-Year Home Population 64,510 Number of Inhabited Houses (end of 1957 according to Rate Books).. 18,440 Rateable Value £770,304 Estimated Product of Penny Rate (Financial Year 1957-58) £3,128 Table 3 AGE and SEX DISTRIBUTION of POPULATION at Census 1951 S = Single M = Married W = Widowed D = Divorced Ma] Les Females Total in Population S M W D Total S M W D Total Under 1 506 _ 506 526 — 526 1,032 1-4 2,460 - - - 2,460 2,414 - - - 2,414 4,874 5-9 2,598 - - - 2,598 2,345 - - - 2,345 4,943 10-14 2,034 - - - 2,034 1,835 - - - 1,835 3,869 15 - 19 3,230 26 - - 3,256 1,682 117 - 1 1,800 5,056 20 - 29 3,185 2,483 5 6 5,689 1,163 3,066 14 9 4,252 9,941 30 - 39 494 3,505 19 36 4,054 388 3,696 108 63 4,255 8,309 40 - 49 275 3,395 51 40 3,761 296 3,215 235 48 3,794 7,555 50 - 59 192 2,352 87 20 2,651 255 2,132 409 34 2,830 5,481 60 - 69 112 1,509 187 6 1,814 239 1,376 811 6 2,432 4,246 70 - 74 34 462 111 - 607 88 337 413 2 840 1,447 75 - 79 15 259 122 - 396 58 148 304 1 511 907 80 - 84 3 77 66 1 147 25 42 184 - 251 398 85 - 89 5 23 36 - 64 16 12 92 - 120 184 90 - 94 - 2 10 — 12 1 2 19 — 22 34 95 & over - - - - - - - 3 - 3 3 Totals 15,143 14,093 694 119 30,049 11,331 14,143 2,592 164 28,230 58,279 Previous Census Population Figures:- 1931... .38,443 1921....35,607 Table 4 LIVE BIRTHS and BIRTH RATE The Gosport Birth Rate Correction Factor (l.00 for 1957) has been applied above to make the comparison on a comparable population distribution as for the whole country. Previous Census Population Figures:- 1931....38 1921....35 LIVE BIRTHS and BIRTH RATE Year Illegitimate M F Total Legitimate M F Total Total Live Births Birt per 1,000 H GOSPORT h Rate ome Population Eng & Wales 1957 27 10 37 550 504 1,054 1,091 16.9 16.1 1956 23 21 44 545 496 1,041 1,085 17.0 15.7 1955 22 24 46 559 445 1,004 1,050 16.8 15.0 1954 33 20 53 503 454 957 1,010 16.0 15.2 1953 23 23 46 524 485 1,009 1,055 17.6 15.5 1952 26 33 59 531 513 1,044 1,103 18.5 15.3 1951 19 22 41 527 480 1,007 .1*248 17.8 15.5 Table 5 STILL BIRTHS -,0*7 1956 1955 1954 1953 1952 1951 Illegitimate i 1 1 2 1 Legitimate 27 14 21 25 15 30 28 Total: 28 14 22 26 17 30 29 A child which has issued forth from its mother after the twenty-eighth week of pregnancy and which did not at any time after being completely expelled from its mother breathe or show any other signs of life is said to be still-born.](https://iiif.wellcomecollection.org/image/b2926375x_0013.jp2/full/800%2C/0/default.jpg)