Public expenditure on health and personal social services 1998 : memorandum received from the Department of Health containing replies to a written questionnaire from the Committee / Health Committee.
- Great Britain. Parliament. House of Commons. Health Committee
- Date:
- 1998
Licence: Open Government Licence
Credit: Public expenditure on health and personal social services 1998 : memorandum received from the Department of Health containing replies to a written questionnaire from the Committee / Health Committee. Source: Wellcome Collection.
127/192 (page 121)
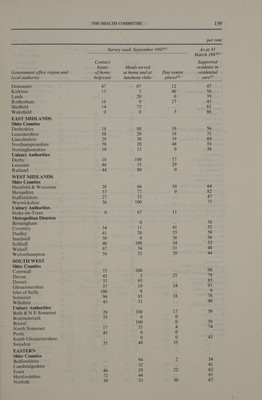
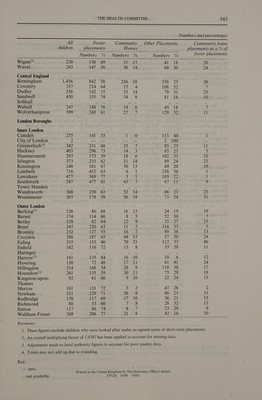
![£ per head Elderly Elderly Residential Domiciliary Children’s | Other PSS Total PSS METROPOLITAN DISTRICTS Bolton 428 223 146 51 164 Bury 392 216 116 46 144 Manchester 556 266 317 73 240 Oldham 419 231 161 56 168 Rochdale 42] eat 161 56 168 Salford 493 252 180 60 199 Stockport 334 198 97 43 135 Tameside 444 230 133 51 163 Trafford 354 202 141 46 150 Wigan 460 221 112 46 150 Knowsley 527 223 222 63 198 Liverpool 539 249 237 66 215 St Helens 459 217 122 48 160 Sefton 388 210 141 48 171 Wirral 372 211 157 49 168 Barnsley 434 228 120 47 161 Doncaster 396 207 128 47 153 Rotherham 453 229 116 48 159 Sheffield 465 249 156 55 186 Gateshead 423 239 145 55 175 Newcastle upon Tyne 432 247 194 62 187 North Tyneside 373 226 143 a4 171 South Tyneside 414 238 153 a 184 Sunderland 446 238 165 54 175 Birmingham 452 229 260 64 205 Coventry 374 204 171 55 165 Dudley 375 205 101 45 142 Sandwell 483 237 183 60 197 Solihull 277 171 106 41 119 Walsall 447 221 196 52 181 Wolverhampton 422 Pale 192 59 186 Bradford 390 223 176 57 168 Calderdale 343 216 134 49 149 Kirklees 376 219 150 49 154 Leeds 373 220 155 52 159 Wakefield 432 223 108 47 150 Total Metropolitan Districts 424 226 171 54 174 Total England ; 361 213 162 hI 159 SHIRE COUNTIES Bedfordshire 325 198 102 41 121 Buckinghamshire 297 194 88 39 112 Cambridgeshire 302 192 96 38 117 Cheshire 301 187 94 39 124 Cornwall 311 190 113 40 148 Cumbria 330 193 98 41 139 Derbyshire 353 200 92 39 135 Devon 281 188 107 39 143 Dorset 245 175 97 37 137 Durham 412 227 117 46 1S), East Sussex 287 210 126 44 168 Essex 320 203 104 42 134 Gloucestershire 286 183 103 40 128 Hampshire 263 186 94 39 115 Hertfordshire 349 215 114 45 138 Kent 318 209 117 44 144 Lancashire 354 200 126 44 148 Leicestershire 278 178 75 35 107 Lincolnshire 281 186 106 39 134 Norfolk 281 190 108 40 138 North Yorkshire 277 192 94 37 128 Northamptonshire 316 196 108 41 125 Northumberland S22 205 104 43 138 Nottinghamshire 318 193 103 4] 130 Oxfordshire 305 196 111 40 121 Shropshire 306 188 85 37 129 Somerset 278 186 103 38 135 Staffordshire 327 188 88 38 120](https://iiif.wellcomecollection.org/image/b32219301_0127.jp2/full/800%2C/0/default.jpg)