Public expenditure on health and personal social services 1998 : memorandum received from the Department of Health containing replies to a written questionnaire from the Committee / Health Committee.
- Great Britain. Parliament. House of Commons. Health Committee
- Date:
- 1998
Licence: Open Government Licence
Credit: Public expenditure on health and personal social services 1998 : memorandum received from the Department of Health containing replies to a written questionnaire from the Committee / Health Committee. Source: Wellcome Collection.
148/192 (page 142)
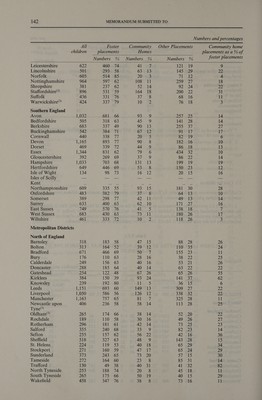
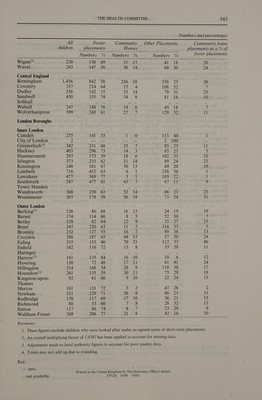
![All Foster children placements Numbers % Leicestershire 622 460 74 Lincolnshire 501 293 58 Norfolk 605 514 85 Nottinghamshire 964 597 62 Shropshire 381 237 “Oz Staffordshire®) 896 531 59 Suffolk 436 331 5G Warwickshire”) 424 337 79 Southern England Avon 1,032 681 66 Bedfordshire 505 318 63 Berkshire 683 337 49 Buckinghamshire 542 384 71 Cornwall 440 536° hh Devon 1,165 893.77 Dorset 469 BS! Salou) 8 Essex 1,344 831 62 Gloucestershire 392 269 69 Hampshire 1,033 703 68 Hertfordshire 649 446 69 Isle of Wight 134 98: 73 Isles of Scilly — —_— — Kent bi BAC Northamptonshire 609 pe A ees Oxfordshire 483 382 79 Somerset 389 298 77 Surrey 633 400 63 East Sussex 749 570 76 West Sussex 683 430 63 Wiltshire 461 ch pe Metropolitan Districts North of England Barnsley 318 183 58 Bolton 313 164 52 Bradford 671 466 69 Bury 176 110 63 Calderdale 249 156 63 Doncaster 288 185 64 Gateshead 254 122 48 Kirklees 384 150 39 Knowsley 239 192 80 Leeds 1.95] 693 60 Liverpool 1,050 586 56 Manchester 1,163 Lat Oa Newcastle upon 406 236 58 Tyne®) Oldham®) 265 174 66 Rochdale 189 110 58 Rotherham 296 181 61 Salford 495 240 68 Sefton piety: 1S G2 Sheffield 518 3277. G3 St. Helens 224 119 53 Stockport 271 160 59 Sunderland 373 243 65 Tameside 272 164 60 Trafford 130 49 38 North Tyneside 253 188 74 South Tyneside 265 175 66 % 19 29 12 27 24 ya) 16 18 an 28 37 17 19 16 18 32 22 Jie 23 15 13 13 27 18 26 26 28 35 a 22 22 26 37 15 rH | 32 28 28 20 26 25 23 16 28 29 24 15 31 32 18 15 Community Other Placements Homes Numbers % Numbers 41 wi 121 63 13 145 20vwis 71 108 11 259 52> 14 92 164 18 200 37, a 68 10; ee 76 SK APE 257 45 9 141 90 13 255 OT ME? 91 jo aaaile) 82 90 8 182 44 9 86 he < 434 37. 9 86 Pls 199 S348 150 16 12 20 93 -b3 18] 37's 64 42 ll 49 62 10 171 41 5 138 7 PAH 180 1 Nea 118 47 15 88 alae 110 SF 155 28 16 38 40 16 53 40 14 63 67 26 65 93 24 141 }1---5 36 149 13 309 126 12 338 SLi 325 58 14 113 38 14 52 30 16 49 42 14 73 35719 82 56 22 42 48 9 143 40 18 65 AT eh 65 73 20 57 23 Mie 85 40 31 41 20 8 45 50. 19 40 Community home placements as a % of foster placements 9 72 4 18 oe 31 11 3 is 14 27 17 6 10 13 10 14 19 12 16 28 10 14 16 7 17 s 26 24 11 25 26 22 55 62 22 22 1] ee 27 23 14 36 i5 34 29 30 14 82 11 29](https://iiif.wellcomecollection.org/image/b32219301_0148.jp2/full/800%2C/0/default.jpg)