Public expenditure on health and personal social services 1998 : memorandum received from the Department of Health containing replies to a written questionnaire from the Committee / Health Committee.
- Great Britain. Parliament. House of Commons. Health Committee
- Date:
- 1998
Licence: Open Government Licence
Credit: Public expenditure on health and personal social services 1998 : memorandum received from the Department of Health containing replies to a written questionnaire from the Committee / Health Committee. Source: Wellcome Collection.
93/192 (page 87)
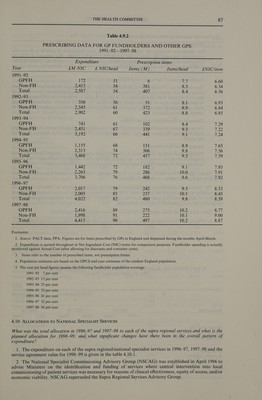
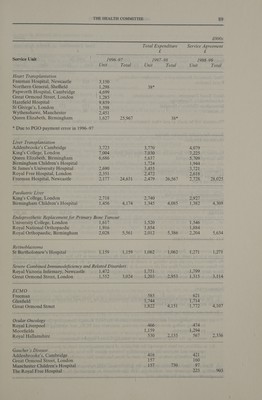
![Oe ee ee eee eee ee ee ee Table 4.9.2 PRESCRIBING DATA FOR GP FUNDHOLDERS AND OTHER GPS: 1991-92—1997_-98 ssn Expenditure Prescription items Year £M NIC £ NIC/head Items (M) Items/head £NIC/item 1991-92 GPFH 172 51 6 Pee 6.60 Non-FH 2,415 54 381 8.5 6.34 Total 2,587 54 407 8.4 6.36 1992-93 GPFH 356 56 51 8.1 6.93 Non-FH 2,545 61 372 8.9 6.84 Total 2,902 60 423 8.8 6.85 1993-94 GPFH 741 61 102 8.4 7.29 Non-FH 2,451 67 339 9.3 fiw: Total 192 66 44] 9.1 7.24 1994-95 GPFH . 1,155 68 151 8.9 7.65 Non-FH 22345 74 306 9.8 7.56 Total 3,468 72 457 9.5 7.09 1995-96 GPFH 1,442 dz 182 9.1 7.93 Non-FH 2,263 79 286 10.0 491 Total 3,706 76 468 9.6 1.92 1996-97 GPFH 2,017 19 242 a5 8.33 Non-FH 2,005 85 237 10.1 8.45 Total 4,022 82 480 9.8 8.39 1997-98 GPFH 2,416 89 275 10.2 8.77 Non-FH 1,998 91 222 10.1 9.00 Total 4,415 90 497 10.2 8.87 Footnotes: 1. Source: PACT data, PPA. Figures are for items prescribed by GPs in England and dispensed during the months April-March. 2. Expenditure is quoted throughout in Net Ingredient Cost (NIC) terms for comparison purposes. Fundholder spending is actually monitored against Actual Cost (after allowing for discounts and container costs). 3. Items refer to the number of prescribed items, not prescription forms. 4. Population estimates are based on the OPCS mid-year estimates of the resident England population. 5. The cost per head figures assume the following fundholder population coverage: 1991-92 7 per cent 1992-93 13 per cent 1993-94 25 per cent 1994-95 35 per cent 1995-96 41 per cent 1996-97 52 per cent 1997-98 56 per cent 4.10 ALLOCATIONS TO NATIONAL SPECIALIST SERVICES What was the total allocation in 1996-97 and 1997-98 to each of the supra regional services and what is the planned allocation for 1998-99; and what significant changes have there been in the overall pattern of expenditure? 1. The expenditure on each of the supra regional/national specialist services in 1996-97, 1997-98 and the service agreement value for 1998-99 is given in the table 4.10.1. 2. The National Specialist Commissioning Advisory Group (NSCAG) was established in April 1996 to advise Ministers on the identification and funding of services where central intervention into local commissioning of patient services was necessary for reasons of clinical effectiveness, equity of access, and/or economic viability. NSCAG superseded the Supra Regional Services Advisory Group.](https://iiif.wellcomecollection.org/image/b32219301_0093.jp2/full/800%2C/0/default.jpg)