Maternity services. Volume II, Minutes of evidence.
- Great Britain. Parliament. House of Commons. Health Committee
- Date:
- 1992
Licence: Open Government Licence
Credit: Maternity services. Volume II, Minutes of evidence. Source: Wellcome Collection.
41/320 (page 373)
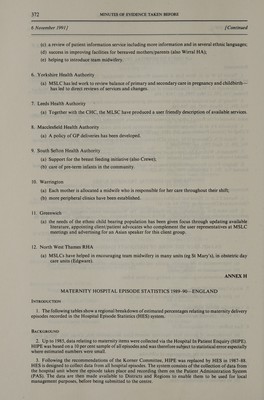
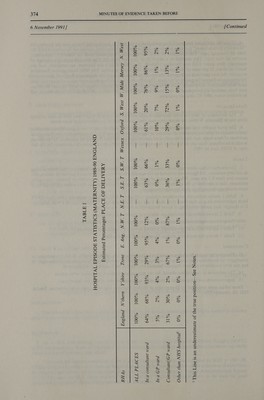
![6 November 199] ] [Continued 4. Given the additional burden of data collection on the NHS it was decided that to ease the burden, the “Maternity Enhancement” (i.e. data relating to delivery and birth episodes), should not be collected until the 1988-89 financial year. This collection of data was eventually postponed until the third (i.e. September) quarter of that year. This resulted in a shortfall of data for 1988-89. The first full year of collection of maternity data under HES was therefore 1989-90. The 1989-90 data are however, not complete, and are based on about 55 per cent of the expected number of delivery episodes. The NHS Management Executive monitors the data provided by Regional Health Authorities and regularly meets with Regional Directors of Information to discuss the quality of the data. The difficulties surrounding the completeness of maternity data have been identified as a priority. This initiative has resulted in real improvements in most regions. Work has now been successfully completed in the area of linking maternity to other systems and an improvement will be evident when 1991-92 data are available. DATA QUALITY 5. The deficiency of data includes incomplete data within Districts and Regions as well as data missing from whole Districts. Within the incomplete data there is evidence of mis-recording of data items. 6. The poor quality and incompleteness of the data make it difficult and often impossible to formulate useful statistical information either at national or regional/district level. It is not meaningful to produce actual numbers of data items and therefore estimated percentages are the best that can be achieved. As the system is still in its infancy, there are no historical data against which to perform validation checks except for the last year of HIPE data in 1985. TABLES 7. The attached tables show regional breakdowns of estimated percentages of some key data items relating to delivery episodes. All figures are rounded to the nearest whole number e.g. where 0 per cent is shown, this means less than 0.5 per cent. Where, because of poor data quality, it is not possible to produce reasonable estimates, this is signified by the symbol ‘“‘“—’’. Where this occurs for the regional data within any category, it casts doubt on that region’s data for other categories. 8. Table | shows estimated percentages relating to Place of Delivery. These estimates differ from OPCS birth registration data in that those data show 2 per cent of maternities being other than in a NHS hospital. It is thought that under-recording of home births within HES is the reason. 9. Table 2 shows estimated percentages relating to Method of Delivery. 10. Table 3 shows estimated percentages relating to Method of Onset of Labour. 11. Table 4 shows estimated percentages relating to Person Conducting Delivery. 12. Table 5 shows the mean and median Duration of Post-natal Stay. CONCLUSION 13. These are the region breakdowns which it has been possible to produce to date. Work is continuing to investigate the feasibility of producing further regional breakdowns relating to Gestation and Birthweight. It has not been possible to produce regional breakdowns relating to Anaesthetic Administered. 14. The estimates in these tables should, for the reasons stated above, be treated with caution. 15. Improvements are being sought in the quality and completeness of data for future years. These tables were produced by Department of Health, Statistics and Management Information, Branch SMI 2B, October 1991.](https://iiif.wellcomecollection.org/image/b32222907_0041.jp2/full/800%2C/0/default.jpg)