[Report of the Medical Officer of Health for London, City of ].
- City of London (London, England). Corporation of London.
- Date:
- 1906
Licence: Attribution-NonCommercial 4.0 International (CC BY-NC 4.0)
Credit: [Report of the Medical Officer of Health for London, City of ]. Source: Wellcome Collection.
18/173 (page 16)
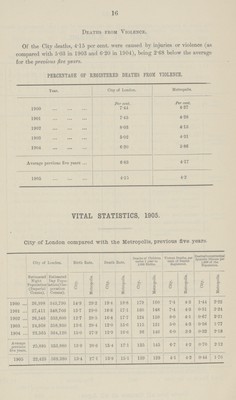
![16 Deaths from Violence. Of the City deaths, 4.15 per cent. were caused by injuries or violence (as compared with 5.03 in 1903 and 6.20 in 1904), being 2.68 below the average for the previous five years. PERCENTAGE OF REGISTERED DEATHS FROM VIOLENCE. Year. City of London. Metropolis. Per cent. Per cent. 1900 7.44 4.27 1901 7.45 4.28 1902 8.03 4.13 1903 5.02 4.31 1904 6.20 3.86 Average previous five years 6.83 4.17 1905 4.15 4.2 VITAL STATISTICS, 1905. City of London compared with the Metropolis, previous five years. City of London. Birth Rate. Death Rate. Deaths of Children under 1 year to 1,000 Births. Violent Deaths, per cent. of Deaths Registered. Deathsfromprincipal Zymotic Disease per 1,000 of the Population] Estimated Night Population (Imperial Census). Estimated Day Popu lation (Cor poration Census). City. Metropolis. City. Metropolis. City. Metropolis. City. Metropolis. City. Metropolis. 1900 26,998 343,790 149 29.2 19.4 18.8 179 160 7.4 4.3 1.44 2.22 1901 27,411 348,760 13.7 29.0 16.6 17.1 160 148 7.4 4.3 0.51 2.24 1902 26,546 353,800 12.7 28.5 16.4 17.7 124 139 8.0 4.1 0.67 2.21 1903 24,958 358,930 13.6 28.4 12.0 15.6 115 131 5.0 4.3 0.56 1.77 1904 23,565 364,120 15.0 27.9 12.9 16.6 96 146 6.0 3.9 0.32 2.18 Average previous five years. 25,895 353,880 13.9 28.6 15.4 17.1 135 145 6.7 4.2 0.70 2.12 1905 22,425 369,380 13.4 27.1 13.9 15.1 139 129 4.1 4.2 0.44 1.70](https://iiif.wellcomecollection.org/image/b18253283_0018.jp2/full/800%2C/0/default.jpg)