[Report 1887] / Medical Officer of Health, Isle of Wight Rural District Council.
- Isle of Wight (England). Rural District Council. n 83204987.
- Date:
- 1887
Licence: Public Domain Mark
Credit: [Report 1887] / Medical Officer of Health, Isle of Wight Rural District Council. Source: Wellcome Collection.
25/50 page 25
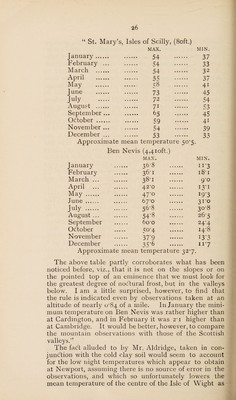
![temperature of 1879 to 1887 was 0‘82 below the average, a very large amount when continued for nine years ! In considering questions of deficient or excessive tem¬ perature we have to multiply intensity by duration. An equivalent of the conditions here noticed would be if eight of the years were of precisely the average tem¬ perature, the ninth being about ]\ below the average. A deficiency of 7J for a whole twelvemonth would be simply miraculous, while the eight years would perform absolutely nothing in the direction of restoring the thermal equilibrium. It is satisfactory to know that warm groups of years occur as well as cold. The mean temperature of the twelve years from 1857 to 1868 was exactly half-a-degree above the average. We are obviously now ‘under a cloud.’ Not since 1872 has there been a year whose mean temperature was 1J above average. In that year it was r6,but in 1868 it was 2-2, and in 1846 it was 24.) The total rainfall of the year was 19-81, or 21*6 per cent, below the average of 73 years, but 1864 was drier by 3-41. Number of wet days, 142.” “At Newport, Isle of Wight, the mean temperature was only 48*3, or o*2 less than that of Llandudno. (The mean seems to work out too low for the latitude.). The total rain was 24-43, being more than that of ‘ Lamorna,’ situated much farthertothewest. Numberofwetdays 141. At Ventnor, Undercliff, Isle of Wight, the mean tem¬ perature of the year (in a somewhat sheltered position, about 150ft. above high water spring tides), was 50-2, or 1-3 below the average of 1850-79. The district seems to have been specially favoured by nature, for the rain, (24‘36)was only 14-9 percent, belowthe averageof 1840-79. The guage is 3ft. above ground. The number of wet days was 135, or 14 per cent, below average The extremes of temperature were 80 (in July) and 25 (in February). The driest month as to rain was March (0-89); the driest as to number of wet days was June (3). The wettest month was November (4-97 on 21 days). The warmest months were July and August (64-2); the coldest was January (39-8). The mean temperature of July was 1-9 above average, August i*6 above, and January 2-3 below. August was very slightly (o*o7) cooler than July. The hours of bright sunshine largely exceeded those of any one of the previous five years, the total being 1,910 (about 5J per diem), or 330 more than at Kew, and 490 more than at Hodsock.” Mr. Aldridge concludes his observations on the year by appending a table shewing the extremes of tempera¬ ture, which took place at our warmest and at our coldest stations :](https://iiif.wellcomecollection.org/image/b29498351_0025.jp2/full/800%2C/0/default.jpg)