[Report 1943] / Medical Officer of Health, Newport (Gwent) County Borough.
- Newport (Wales). County Council.
- Date:
- 1943
Licence: Attribution 4.0 International (CC BY 4.0)
Credit: [Report 1943] / Medical Officer of Health, Newport (Gwent) County Borough. Source: Wellcome Collection.
34/86 page 32
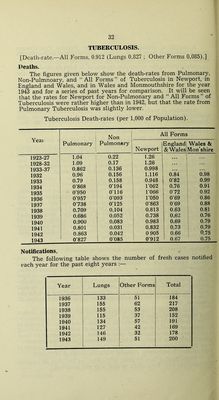
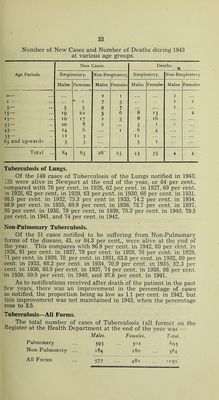
![TUBERCULOSIS. [Death-rate—All Forms, 0.912 (Lungs 0.827 ; Other Forms 0.085).] Deaths. The figures given below show the death-rates from Pulmonary, Non-Pulmnoary, and “ All Forms ” of Tuberculosis in Newport, in England and Wales, and in Wales and Monmouthshire for the year 1943 and for a series of past years for comparison. It will be seen that the rates for Newport for Non-Pulmonary and “ All Forms ” of Tuberculosis were rather higher than in 1942, but that the rate from Pulmonary Tuberculosis was slightly lower. Tuberculosis Death-rates (per 1,000 of Population). Year Pulmonary Non Pulmonary All Forms Newport England & Wales Wales & Mon’shire 1923-27 1.04 0.22 1.26 1928-32 1.09 0.17 1.26 1933-37 0.862 0.136 0.998 ... . . . 1932 0.96 0.156 1.116 0.84 0.98 1933 0.79 0.158 0.948 0*82 0.99 1934 0‘868 O'194 r062 0.76 0.91 1935 0'950 0116 1*066 0 72 0.92 1936 0‘957 0'093 1*050 0*69 0.86 1937 0738 0*125 0*863 0*69 0.88 1938 0.709 0.104 0.813 0.63 0.81 1939 0.686 0.052 0.738 0.62 0.76 1940 0.900 0.083 0.983 0.69 j 0.79 1941 0.801 0.031 0.832 0.73 i 0.79 1942 0.863 0.042 0 905 0.66 ! 0.75 1943 0'827 0'085 0*912 0.67 0.75 Notifications. The following table shows the number of fresh cases notified each year for the past eight years Year Lungs Other Forms Total 1936 133 51 184 1937 155 62 217 1938 155 53 208 1939 115 37 152 1940 134 57 191 1941 127 42 169 1942 146 32 178 1943 149 51 200](https://iiif.wellcomecollection.org/image/b28866848_0036.jp2/full/800%2C/0/default.jpg)