Census 1951, England and Wales : preliminary report.
- General Register Office Northern Ireland
- Date:
- 1951
Licence: Public Domain Mark
Credit: Census 1951, England and Wales : preliminary report. Source: Wellcome Collection.
14/80
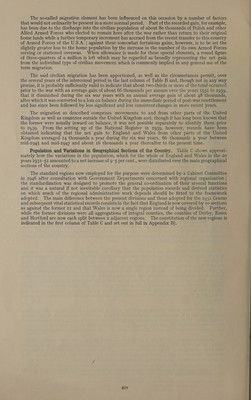
![Intercensal Movement. The provisional net intercensal increase of 3,793 thousands may be resolved into its more important clements as follows :— Increase :— (thousands) Live Births in England and Wales se “H(G)215;207 Decreases :— Deaths registered in England and Wales— Total (excluding non-civilians after 3rd September, 1939) (—) 9,943 Non-civilian (after 3rd September, 1939) (—) 66 Deaths of non-civilians and merchant seamen “belonging 1 to England and Wales which occurred outside ny and Wales after 3rd September, 1939 (estimated) (—) 240 Increase :— Balance representing a net gain from the miscellaneous movements sumined up in the term “ migration ”’ Et a (+) 745 Net intercensal increase .. (+) 3,793 (See Notes to Tables A and B) Table A shows these movements in comparison with those of preceding intercensal periods since 1871. rch delet (figures in thousands) Excess of Balance Intercensal Live Births Deaths in Live Births Tepreseniiny, Intercensal Period. Increase in in England England over Deaths fet eae ke Population. and Wales. and Wales. in England oss (—) by and Wales: migration of all types. 1871-1881 3,262 8,604 5,178 3,426 — 164 1881-1891 3,028 8,894 5,265 3,629 — 601 1891-1901 3,525 9,157 5,563 3,594 ae IQOI-IQII 3,543 9,290 5,246 4,044 a ee IQII-Ig92I 1,816 8,281 5,268 3,013 — 1,197* I192I-1931 2,066 6,928 4,692 2,236 _ 170 I93I-IQ5I (20 years) 3,793 13,297 3,288 * Including losses of 577 and 240 thousands of non-civilians and merchant seamen belonging to England and Wales who died outside the country during 1914-18 and from 1939 respectively (see also Table B). I0,009 In Table B, the movements of more recent periods are shown for individual years or by annual averages so that the more important changes in amount and direction may be more precisely located. Table B (figures in thousands) Deaths registered in England and Wales. Estimated : : Excess of Merchant net gain pase Live Births |, Seaman | or Joss Year in England belonging to ee d Wal Non- over Deaths Lehn (—) due to (July to June). an ales. Civilians | in England u Neve civilian Total. included | and Wales. ens 33 migration. in Total. gene and Wales (approximate) i t § 1921-26 (5 years) .. 750 469 =— A 1926-31 (5 », ) 654 484 5 Yearly |] | | Ap |] |] Averages ) 1931-39 (8 ,, ).. 607 489 118 66 1939-45 (6 ,, ).. 650 514 9 136 (see below) 48 1945-50 (5 ,, ).. 781 496 2 285 — 12 1931-32 626 484 142 71 1932-33 599 493 106 43 1933-34 584 483 IOI 16 1934-35 594 466 128 50 1935-36 602 496 106 88 1936-37 609 505 104 88 1937-38 621 484 137 47 1938-39 618 497 121 124 1939-40 605 550 4 55 173 1940-41 569 575° 12 ex RO tig 1941-42 618 485 9 133 94 1942-43 678 462 10 216 85 1943-44 718 513 II 205 aS 1944-45 713 499 10 214 240 o 1945-46 737 489 4 228 — 40 1946-47 gII 523 2 388 =e 1947-48 811 401 2 350 28 1948-49 751 y 508 I 243 — 28 1949~—50 aI! 501 I 202 19 * Actual birth occurrences 1939 to 1949 inclusive ; numbers registered in other periods. t Not available for periods prior to 3rd September, 1939. The figures exclude deaths of non-civilians of Dominions, Colonics or Foreign Countries which occurred in England and Wales. 3 Estimate based on figures for the United Kingdom supplied by the War Departments, including the “Missing, Presumed Dead’. The proportion assigned to England and Wales (about 89 per cent.) was based upon the numbers originally recruited from the several parts of the United Kingdom. § Total migration for years prior to 1931.](https://iiif.wellcomecollection.org/image/b32183215_0014.jp2/full/800%2C/0/default.jpg)




 No text description is available for this image
 No text description is available for this image
 No text description is available for this image