Report of the Medical Officer of Health / Municipality of Colombo.
- Colombo (Sri Lanka). Public Health Department
- Date:
- [1913]
Licence: Public Domain Mark
Credit: Report of the Medical Officer of Health / Municipality of Colombo. Source: Wellcome Collection.
27/68 (page 47)
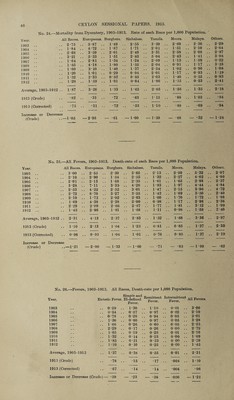
![No. 27. All Fevers, 1903—1913. Death-rate of each Ward per 1,000 Population. Year. Colombo Town. Fort and Galle Face. 1 San Sebastian. | St. Paul’s. Kotahena. New Bazaar. Maradana. Slave Island. Kollupitiya. Eastward Extension. Wellawatta Extension. 1903 .. 3*00 0-39 1-69 1-52 1-98 3-58 2-75 1-57 4*72 2-08 1904 . . 2-10 1-51 0-51 1-39 1-06 3-79 1-79 0-93 2-11 0-78 _ 1905 . . 2-01 0-36 1*16 0-87 2-21 1-70 2-00 1-26 2-05 1-38 ___ 1906 .. 328 1-74 0-77 2-39 1-77 2-45 2-41 2-41 3-70 2-63 __ 1907 .. 2-53 — 115 2-34 1-74 2-33 1-91 2-48 2-25 1-07 _ _ 1908 .. 2-72 0-63 0-38 1-56 1-37 1-45 1-91 1-89 2-73 2*78 _ _ 1909 .. 2-10 0-30 0-75 1-43 1-38 1-68 1-54 1-28 1-75 0-96 _ , 1910 .. 1-69 0-60 1-07 0-90 1-31 1-77 1-14 1-08 1-34 1-72 _ __ 1911 .. 2-29 1-12 1-63 2*15 3 05 2-08 1-58 0-97 1-90 1-11 0-36 - ' 1912 .. 1-45 0-28 0-24 1-51 0-70 1-38 0-78 0-93 0-92 0*46 0-35 0-40 Average, 1903-1912 .. 2-31 0-72 0-92 1-65 1-65 2-19 1-75 1-47 2-25 1-44 0-36 0-40 1913(Crude) 1-10 — •47 •82 •46 1-05 •42 •71 •73 •64 •35 •78 1913 (Corrected) •96 — •95 •90 •53 1-21 •68 •93 •94 •90 •89 1-69 Increase or Decrease (Crude) —1-21 — -72 — -45 — -83 —1-19 —114 —1-33 — -76 —1 • 52 — *80 — -01 + *38 No. 28.—Fevers, 1903-1913. Cases notified. Year. Enteric Fever. Simple Continued All Fevers. 1903 .. 262 • • — 262 1904 .. 303 • • — 303 1905 .. 454 , , 25 479 1906 .. 948 , , 42 990 1907 .. 946 , , 121 1,067 1908 .. 1,370 251 1,621 1909 .. 794 , , 119 913 1910 .. 876 , , 79 t. 955 1911 .. 1,149 . # 71 1,220 1912 .. 621 113 734 Average, 1903-1912 772 • • 82 854 1913 .. 465 • • 96 561 Increase or Decrease 307 + 14 — 293 N.B.—This Table includes Port, Outside, and Untraced Cases. No. 29.—Fevers, 1913. Cases notified by Races. Race. Enteric Fever. Continued Fever. All Fevers. Case-rate per ] Population All Races .. 465 . 96 561 2-41 Europeans .. 28 4 32 9-87 Burghers 44 12 56 3-65 Sinhalese ..261 58 319 3-06 Tamils 58 16 74 1-30 Moors 35 3 38 0-92 Malays 12 . - 12 2-06](https://iiif.wellcomecollection.org/image/b31753395_0027.jp2/full/800%2C/0/default.jpg)