An introduction to the theory of mental and social measurements / by Edward L. Thorndike.
- Edward Thorndike
- Date:
- 1904
Licence: In copyright
Credit: An introduction to the theory of mental and social measurements / by Edward L. Thorndike. Source: Wellcome Collection.
171/232 page 155
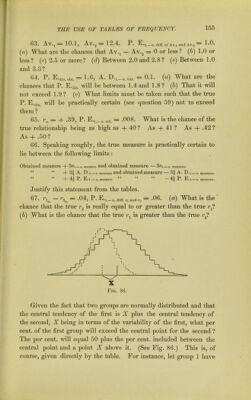
![53. iVv.j — 10.Ij A.V.2 — 12.4. P. E»t.—o. diff. of Av.j and Av,2 1.0. (а) What are the chances that Av.^ — Av.2 = 0 or less? (b) 1.0 or less? (c) 2.5 or more? {d) Between 2.0 and 2.8? (e) Between 1.0 and 3.3? 64. P. = E6, a. D.t._o.var. = («) What are the chances that P. E.^^g will be between 1.4 and 1.8? (h) That it will not exceed 1.9 ? (c) What limits must be taken such that the true P. E.jiig will be practically certain (see question 59) not to exceed them ? 65. = + .39, P. E.t._o. rei. = -008. What is the chance of the true relationship being as high as + 40 ? As -f 41 ? As + .42 ? As + .50? ' « 66. Speaking roughly, the true measure is practically certain to lie between the following limits : 0bt£lin6d. lHGclSU.r6 — o. measure tUld. obt3.1I16(i niG£lSUrG 3(Tt.— o. measure- “ “ + 3| A. D ■ t.— o. measure and obtainGd mGasurG — 3| A. D.t._o. measure. U U L /II T> T? << /II T> TP “]“ ^2 — 0. measure • -!-/• t.—o. measure* Justify this statement from the tables. 67. = .04, P. = -06. (a) What is the ' chance that the true is really equal to or greater than the true r^? (б) What is the chance that the true ?\ is greater than the true r^? Fig. 86. Given the fact that two groups are normally distributed and that the central tendency of the first is A plus the central tendency of the second, X being in terms of the variability of the first, what per cent, of the first group will exceed the central point for the second ? The per cent, will equal 50 plus the per cent, included between the central point and a point X above it. (See Fig. 86.) This is, of course, given directly by the table. For instance, let group 1 have](https://iiif.wellcomecollection.org/image/b28082370_0171.jp2/full/800%2C/0/default.jpg)