Sixty-sixth annual report on the health and sanitary condition of the Metropolitan Borough of Islington.
- Islington (London, England). Metropolitan Borough.
- Date:
- 1922
Licence: Attribution-NonCommercial 4.0 International (CC BY-NC 4.0)
Credit: Sixty-sixth annual report on the health and sanitary condition of the Metropolitan Borough of Islington. Source: Wellcome Collection.
14/62 (page 6)
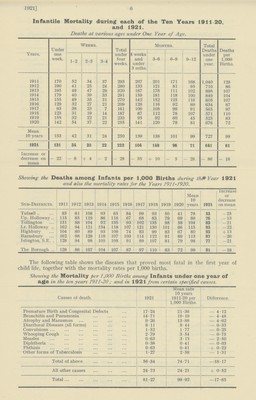
![1921] 6 Infantile Mortality during each of the Ten Years 1911 20, and 1921. Deaths at various ages under One Year of Age. Years. Under one week. Weeks. Total under four weeks. Months. Total Deaths under one year. Deaths per 1,000 Births. 4 weeks and under 3 mths. 3-6 6-9 9-12 1-2 2-3 3-4 1911 170 52 34 37 293 207 201 171 168 1,040 128 1912 190 41 25 24 280 133 121 81 95 710 86 1913 195 49 47 29 320 187 178 111 102 898 107 1914 179 40 39 33 291 159 181 118 100 849 104 1915 155 49 35 31 270 142 152 125 116 805 107 1916 129 32 27 21 209 128 116 92 89 634 87 1917 93 38 23 7 161 106 108 99 91 565 97 1918 123 31 19 14 187 87 112 78 107 571 110 1919 158 32 22 21 233 95 92 60 45 525 83 1920 142 54 37 22 255 141 120 79 81 676 72 Mean 10 years 153 42 31 24 250 139 138 101 99 727 99 1921 131 34 35 22 222 104 148 96 71 641 81 Increase or decrease on mean - 22 - 8 + 4 - 2 - 28 - 35 + 10 - 5 - 28 - 86 - 18 Showing the Deaths among Infants per 1,000 Births during the Year 1921 and also the mortality rates for the Years 1911-1920. Sub-Districts. 1911 1912 1913 1914 1915 1916 1917 1918 1919 1920 Mean 10 years 1921 Increase or decrease on mean Tufnell 85 61 108 93 65 84 99 93 50 41 78 53 -25 Up. Holloway 115 85 119 86 118 67 68 83 79 69 89 76 -13 Tollington 131 88 104 92 135 93 102 135 98 58 104 83 -21 Lr. Holloway 162 94 121 134 118 107 121 130 101 66 115 93 -22 Highbury 104 80 89 93 109 74 83 99 83 67 80 93 +13 Barnsbury 162 98 128 119 107 103 114 122 91 89 113 87 -26 Islington, S.F. 128 94 98 105 108 91 89 107 81 79 98 77 -21 The Borough 128 86 107 104 107 87 97 110 83 72 99 81 -18 The following table shows the diseases that proved most fatal in the first year of child life, together with the mortality rates per 1,000 births. Showing the Mortality per 1,000 Births among Infants under one year of age in the ten years 1911-20; and in 1921 from certain specified causes. Causes of death. 1921 Mean rate 10 years 1911-20 per 1,000 Births. Difference. Premature Birth and Congenital Defects 17.24 21.36 — 4.12 Bronchitis and Pneumonia 14.71 19.19 — 4.48 Atrophy and Marasmus 9.26 13.88 — 4.62 Diarrhœal Diseases (all forms) 8.11 8.44 — 0.33 Convulsions 1.52 1.77 — 0.25 Whooping Cough 2.79 3.54 — 0.75 Measles 0.63 3.13 — 2.50 Diphtheria 0.38 0.41 — 0.03 Phthisis 0.63 0.41 + 0.22 Other forms of Tuberculosis 1.27 2.58 — 1.31 Total of above 56.54 74.71 —18.17 All other causes 24.73 24.21 + 0.52 Total 81.27 98.92 —17.65](https://iiif.wellcomecollection.org/image/B18222250_0014.jp2/full/800%2C/0/default.jpg)