Sixty-sixth annual report on the health and sanitary condition of the Metropolitan Borough of Islington.
- Islington (London, England). Metropolitan Borough.
- Date:
- 1922
Licence: Attribution-NonCommercial 4.0 International (CC BY-NC 4.0)
Credit: Sixty-sixth annual report on the health and sanitary condition of the Metropolitan Borough of Islington. Source: Wellcome Collection.
58/62 (page 48)
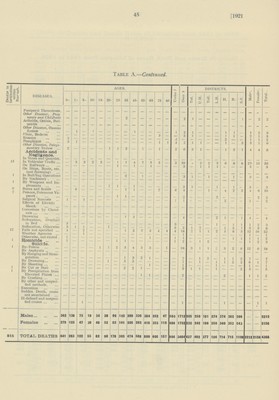
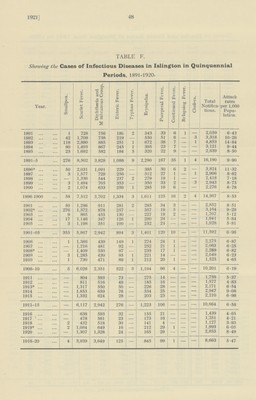
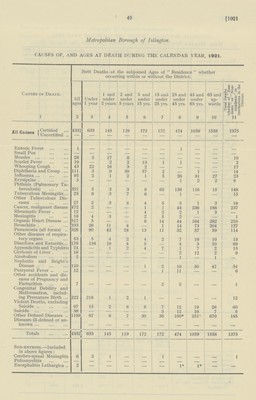
![1921] 48 TABLE F. Showing the Cases of Infectious Diseases in Islington in Quinquennial Periods, 1891-1920. Year. Smallpox. Scarlet Fever. Diphtheria and Mmbranous Croup. Enteric Fever. Typhus Fever. Erysipelas. Puerperal Fever. Continued Fever. Relapsing Fever. Cholera. Total Notifica tions. Attack rates per 1,000 Popu lation. 1891 1 728 756 189 2 343 33 6 1 2,059 6.43 1892 42 1,709 738 219 550 51 6 3 3,318 10.26 1893 118 2,880 885 251 1 672 38 7 1 4,853 14.84 1894 90 1,493 867 245 1 395 23 7 — 3,121 9.44 1895 25 1,692 582 184 5 320 22 9 — 2,839 8.50 1891-5 276 8,502 3,828 1,088 9 2,280 167 35 1 4 16,190 9.90 1896* 50 2,031 1,091 229 — 385 30 6 2 3,824 11.32 1897 3 1,577 729 256 312 27 1 — 1 2,906 8.62 1898 1,336 544 237 2 279 19 1 — — 2,418 7.18 1899 3 1,494 705 353 350 33 2 — 3 2,943 8.75 1900 2 1,074 633 259 1 285 16 6 — — 2,276 6.78 1896-1900 58 7,512 3,702 1,334 3 1,611 125 16 2 4 14,367 8.53 1901 50 1.286 911 281 2 285 34 3 — 2,852 8.51 1902* 276 1,372 878 257 — 357 19 5 — — 3,164 9.29 1903 9 865 455 130 — 227 19 2 — — 1,707 5.12 1904 17 1,146 347 126 1 280 24 — — — 1,941 5.84 1905 3 1,198 351 100 — 252 24 — — — 1,928 5.81 1901-05 355 5,867 2,942 894 3 1,401 120 10 — 11,592 6.96 1906 1 1,386 439 149 1 274 24 1 — — 2,275 6.87 1907 — 1,216 481 92 — 252 21 1 — — 2,063 6.25 1908* 1,409 530 97 235 17 1 — — 2,289 6.82 1909 3 1,285 430 95 1 221 14 — — — 2,049 6.23 1910 1 730 471 89 1 212 20 1 — — 1,525 4.65 1906-10 5 6,026 2,351 522 3 1,194 96 4 — — 10,201 6.19 1911 804 593 73 275 14 — 1,759 5.37 1912 — 811 516 49 185 16 — — — 1,577 4.83 1913* 1,317 550 50 226 28 — — — 2,171 6.54 1914 1.853 659 76 334 25 — — — 2,947 9.08 1915 — 1,332 624 28 — 203 23 — — — 2,210 6.98 1911-15 — 6,117 2,942 276 — 1,223 106 — — — 10,664 6.58 1916 — 638 593 32 155 21 — 1,439 4.65 1917 478 561 23 173 16 — — — 1,251 4.21 1918 2 432 518 30 141 4 — — — 1,127 3.93 1919* 2 1,084 649 16 212 29 1 — — 1,993 6.05 1920 1,307 1,328 24 — 165 29 — — 2,853 8.49 1916-20 4 3,939 3,649 125 — 845 99 1 — — 8,663 5.47](https://iiif.wellcomecollection.org/image/B18222250_0058.jp2/full/800%2C/0/default.jpg)