[Report 1971] / Medical Officer of Health, Ince-in-Makerfield U.D.C.
- Ince-in-Makerfield (England). Urban District Council.
- Date:
- 1971
Licence: Attribution 4.0 International (CC BY 4.0)
Credit: [Report 1971] / Medical Officer of Health, Ince-in-Makerfield U.D.C. Source: Wellcome Collection.
8/32 page 6
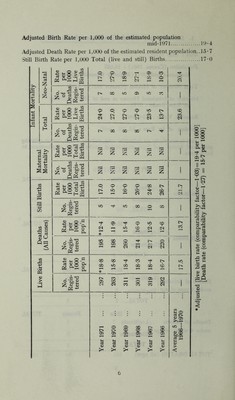
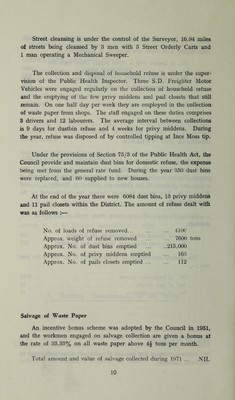
![Adjusted Birth Rate per 1,000 of the estimated population mid-1971 19-4 Adjusted Death Rate per 1,000 of the estimated resident population..l5*7 Still Birth Rate per 1,000 Total (live and still) Births 17-0 Infant Mortality Neo-Natal Rate per 1000 Live Births 17.0 27*0 18*9 27*1 18-9 10-3 20.4 No. of Deaths Regis- tered l> 00 ID 05 CO ! 23.6 — J Total Rate per 1000 Live Births 24-0 27.0 ! 27-0 27-0 23-5 13*7 No. of Deaths Regis- tered I> 00 00 00 TT i Maternal Mortality Rate per 1000 Total Births Nil Nil Nil Nil Nil 1 Nil ! i No. of Deaths Regis- tered i Nil Nil Nil Nil Nil Nil i Still Births Rate per 1000 Total Births o © © © oo t> K ib i (b Tt m •—( 1 C<1 i> No. Regis- tered ic Tf LC 00 O GO r—« l Deaths (All Causes) Rate per 1000 pop’n | *12-4 11- 9 15- 4 16- 0 12- 5 12-6 CO 1 No. Regis- tered 195 198 260 214 217 220 Live Births Rate per 1000 pop’n |*18-8 15- 8 18-4 18-3 18-4 16- 7 17.5 No. Regis- tered 297 263 311 301 319 292 i :::::: CO u o • cd |> a? o> ►»1-M 1 '-1 O 05 00 t> CO ID | l>» CD CD CD CD CD 05 05 05 05 05 05 <L> CD t-H I—J l-H 1-H r—i U U U Ih 1-1 L* I-. cd cd cd cd cd cd <V QJ 0) c) 0^ 0) > K* >< >* > < Adjusted [live birth rate (comparability factor—1-03) = 19-4 per 1000] [Death rate (comparability factor—1-27) = 15-7 per 1000]](https://iiif.wellcomecollection.org/image/b29495635_0008.jp2/full/800%2C/0/default.jpg)